
Okay, February 19, 2026. You log in, eyes half-shut, hoping for a clear path, something easy, right?
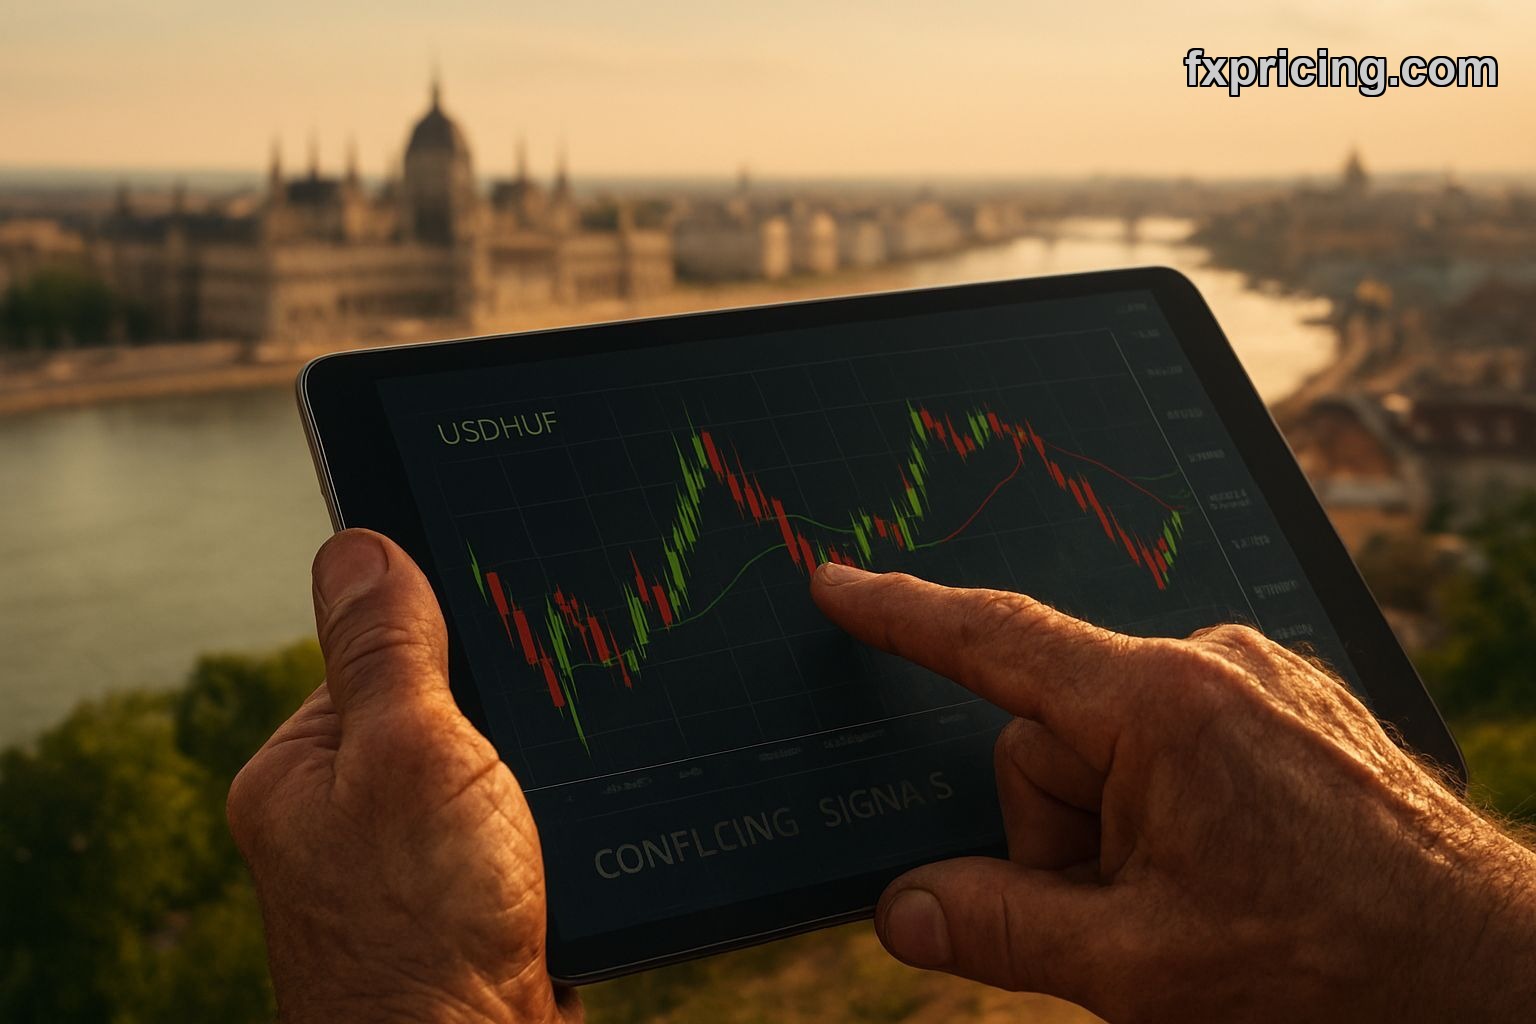
Not with USD/HUF (OANDA EU Clients) today. Nope. You get a chart that practically screams, "Good luck, sucker." It's sitting there at 321.56, barely moved, just a whisper lower than its open, a tiny -0.062% dip. And the Fxpricing Blog system, bless its digital heart, spits out a "Sell" signal.
The Sell Signal That Doesn't Quite Convince
A sell signal, sure. With medium confidence, too, which always makes you wonder how confident is medium confidence, really? Is it like "I think I left the stove on" medium confidence or "I might have forgotten to feed the dog" medium confidence? Anyway, the signal score is -35. Not exactly a conviction trade, is it?
But here's where it gets interesting, or maybe just infuriating. The general trend for this pair? Strong. Price action? Bullish. Let that sink in. The machine is telling me, and you, to sell this thing, but then it turns around and says, "Oh, but the underlying action is kinda bullish."
What am I supposed to do with that? It's like being told to jump off a cliff, but the cliff is made of trampolines. It makes no damn sense. This isn't just confusing, it's almost intentionally misleading.
Oscillators Screaming BUY Against The Tide
Alright, so we’ve got a weak sell signal, but a strong bullish price action. Fine. But then you look at the oscillators and the plot thickens. Or thins, depending on your perspective.
The Average True Range (ATR) is clocking in at 2.3923. Guess what it says? Strong Buy. Not just "Buy," but "Strong Buy." And the Parabolic SAR, which I've seen be pretty reliable for quick flips, is at 316.864, also yelling "Strong Buy."
This isn't just a nuance; it's a full-blown contradiction. How can the system issue a general sell signal for the USD/HUF (OANDA EU Clients) pair when its internal components are shouting "Strong Buy"? It feels like one of those days where you flip a coin and it lands on its edge, leaving you more confused than before you started.
I remember one time I completely ignored the broader signal and went with the oscillators. It was a smaller pair, can't even recall which one, but the short-term indicators were flashing buy like crazy, while the overall consensus was still bearish. I jumped in, against my better judgment, thinking I was smarter than the algorithm. Got my fingers burned good. Ended up closing out for a hefty loss.
The Long-Term Bear Trap: Moving Averages Don't Lie
Now, if the oscillators have you feeling a little bullish, maybe even thinking about picking up some USD/HUF (OANDA EU Clients) right now, hold your horses. Because the moving averages are having none of it. Absolutely none of it.
These big, slow-moving beasts, they just do not care about your little bullish price action today. Or the strong buy signals from ATR. They are firmly, emphatically, stubbornly in "Strong Sell" territory. Look at these numbers:
- SMA 100: 328.488 (Strong Sell)
- EMA 100: 328.079 (Strong Sell)
- SMA 200: 334.816 (Strong Sell)
Every single one of them is significantly above the current 321.56 price. These aren't just selling, they're practically screaming that anyone who bought around these levels is underwater, big time. And they're telling you that the long-term trend, the real monster under the bed, is down. Way down. This suggests that any short-term bullishness might just be a head fake, a dead cat bounce, whatever cliché you want to throw at it.
This is where "USD/HUF (OANDA EU Clients) forecast 2026" really starts to look murky. If the long-term averages are this far north and pointing down, it suggests some serious headwinds. It's like the market is saying, "Sure, a short-term pop, but don't get comfortable, because gravity is a thing."
Pivots, Bollinger Bands: What's the Noise About?
So, we're stuck. General signal says sell, oscillators say buy, moving averages say strong sell. What about the other noise? Let's check the pivot points, see if they offer any clarity for the USD/HUF (OANDA EU Clients) price today.
Woodie pivot is at 321.21. Classic is at 320.937. Our current price, 321.56, is just above both of those. That means we're dancing right around the central pivot. It’s neither a clear break-out nor a definitive breakdown. Just.. there. Right on the edge.
The resistance levels aren't far either. Woodie R1 is 323.71, Classic R1 is 323.163. Not a huge distance from where we are now. If there's a quick pop, those will be the lines to watch. For more live forex rates, check out the Fxpricing Blog's live rates page.
And then there's Bollinger Bands. The Middle band is at 320.263. Current price is above that, so it kinda leans bullish on the intraday scale, or at least not crashing. Position is at 77.99%, suggesting we're pretty high up in the band, pushing towards the upper range, which you’d think would indicate upward pressure. But with a "Normal" squeeze and "Low" volatility (ATR%: 0.7429), it's not exactly signaling an explosion in either direction.
It's just… a lot of mixed signals, isn't it? Volatility is low, which usually means things are quiet, but quiet doesn't mean clear when the indicators are fighting each other like cats and dogs.
My Two Cents: A Trader's Conundrum
So, where does that leave us with our USD/HUF (OANDA EU Clients) analysis? If you asked me for a clear "USD/HUF (OANDA EU Clients) buy or sell" answer, I'd say I'm looking at a mess. A beautiful, frustrating mess.
The overall signal wants to sell. Okay. But everything short-term that generates momentum, ATR, Parabolic SAR, and even the "Bullish" price action? All points north. Then the real titans, the SMA and EMA 100 and 200, they are absolutely hammering the sell button. You can check out other pairs like EUR/USD to see how they behave.
This feels like a market designed to chew up confident traders and spit out their confidence in tiny pieces. You see that slight dip today, that -0.062%, and the 1-week performance showing a gain of 0.66675%. It’s up over the week, yet today's signal is sell. That's a perfect setup for a whipsaw.
I learned the hard way not to ignore the big picture just because the smaller picture winks at you. Those long-term moving averages are like a giant hand pushing down on the price, and unless something fundamental shifts dramatically, those "Strong Sell" labels on SMA 100, EMA 100, and SMA 200 aren't going anywhere fast.
So, is this a buy? Probably not if you're looking for anything more than a scalp. And is it a sell? Sure, but with that bullish price action and strong buy oscillators, you'd better have some tight stops. I got wiped out a few years back on AUD/USD thinking I had a clear short, only to see it pop when the smaller indicators reversed, then the long-term moved too. Lesson learned.
The "USD/HUF (OANDA EU Clients) prediction" here is more about navigating conflicting tides than sailing smoothly. It's about respecting the strength of the long-term trends while not getting blindsided by short-term optimism.
The current volatility is low. Maybe this is a quiet period before a bigger move. Or maybe it's just a market trying to confuse everyone into doing nothing. My gut says: wait for clearer signals, or at least a signal where the main system and the oscillators are on the same page. If you're going to trade this, be nimble.
Given the long-term averages screaming sell, and those pivots so close to the current price, is the USD/HUF (OANDA EU Clients) heading for a major downward trend in 2026, or will those bullish price actions finally break the long-term resistance?


