

SGD/JPY sits at 124.482 as of today, March 16, 2026. Seems like a simple fact, right? But sometimes simple facts hide a mess of conflicting signals. And right now, this pair, the Singapore Dollar against the Japanese Yen, it’s giving me flashbacks to trades I wish I’d never made.
We’re barely breathing distance from the All-Time High, sitting there at 124.783. That's a jump of only 0.301 from where we are now. A whisker. A hair. It smells like a breakout. Or a trap. My gut? It's churning. Because for every bullish indicator screaming "buy", there's one shouting "sell", and you better believe I pay attention to both, especially when we’re this close to making history.
All-Time High Challenge for SGD/JPY
So, 124.783. The highest this pair has ever traded. Ever. And we’re at 124.482. It's like watching a tightrope walker at the very peak, one tiny step from either triumph or a plummet. The change today is +0.126%, not massive, but it’s pushing, always pushing. This whole push, it’s bullish. Price Action is clearly bullish. The overall trend? Strong. It really is. Everyone sees it.
My last attempt to predict an ATH break, well, let's just say I learned that "almost there" can mean "nowhere near" in the world of forex. I remember sitting there, watching EUR/JPY, thinking it was a done deal. Spoiler: it wasn't. Check the EUR/JPY charts if you want to see what a proper reversal looks like when you least expect it.
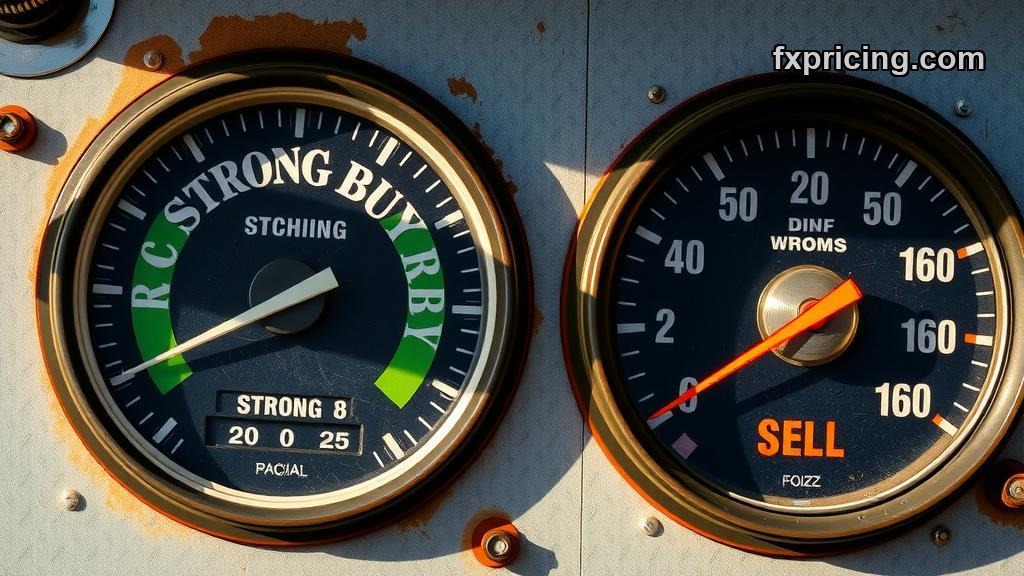
But the market right now for SGD/JPY is clearly hyped. The system gives us a straight-up "Strong Buy" signal. Not just 'buy', but strong. The ATR? That's also flashing Strong Buy. Most folks would look at that, see the price so close to its ceiling, and dive in. I get it. The temptation is real.
Conflicting Signals: Buy the Dip or Bail Out?
Here’s where it gets interesting, or maybe just infuriating depending on how much sleep you got last night. While the trend and the signal are screaming "strong buy," there's another voice. A loud one. The Stochastic K% is shouting "Strong Sell". Not just 'sell'. Again, strong. What do you do with that?
It's like getting two completely different maps to the same treasure chest. One says 'dig here, it's gold'. The other says 'there's a monster there, run'. That 'Strong Sell' on Stochastic K% sitting up at 88.9681? That’s high. That screams overbought, peak, time to reverse. But the price itself, the raw action, it’s not listening.
You have to wonder, is this the market faking everyone out? Is it tempting you to jump in right before it pulls the rug? I've seen it happen. Many times. Ignored a 'Strong Sell' like that once, on a crypto pair, thinking the momentum was too strong to fail. Let's just say the dip wasn't really a "dip", more like a crater. For live market movements across everything, really helps to keep an eye on all the forex rates, keeps you grounded.
The Moving Average View
So, what about the averages? Do they help clear anything up? Not entirely. The SMA 10 is sitting neutral at 123.928. That's, well, neutral. Not telling us much. It's just sitting there, taking a nap, while the big players duke it out.
But the EMA 100, which smooths out price data over a longer period, is clearly a Strong Buy at 121.199. That indicates a solid, long-term bullish posture. So, we've got a short-term moving average saying nothing, and a long-term average supporting the "strong buy" camp. It's a mixed bag, adding to the confusion. You look at these numbers, you try to find a pattern, and sometimes, the market just laughs in your face.
Pivot Points and the Next Moves
Let's talk pivot points. They’re like little signposts. The Classic Pivot Point is at 124.521. We’re currently just below it at 124.482. Resistance 1 (R1) is 124.712. Look how close that is to the All-Time High of 124.783. It's practically the same level. This suggests that if the price pushes above the pivot, R1 is going to be a massive fight. A real battleground.
The Demark pivot, a bit different, puts its R1 at 124.617. Again, very tight to the current price and the ATH. If SGD/JPY does manage to break through this resistance cluster and the All-Time High, that would be a monumental shift. But then you have to ask yourself, with Stochastic screaming 'Strong Sell', how much staying power does that breakout really have? Could be a false flag. Could be a quick wick then a dump.
Volatility? It's low, ATR% at 0.5572. Low volatility with a strong trend can sometimes lead to sharp moves when it breaks. The calm before the storm. That’s usually how it feels. Maybe you need to keep one of those forex widgets on your desktop, watch every tick right now.
So, here we are, March 2026. SGD/JPY. Almost touching its all-time peak. The air is thin up here. Most of the signals point to "Strong Buy". Price action? Bullish. Trend? Strong. But that Stochastic K%? A very loud, very clear "Strong Sell". Which voice do you listen to? The one that's been consistently right for the past year, or the contrarian screaming from the rooftops? Sometimes, you just gotta pick a side and accept whatever happens. That’s trading, I guess.


