
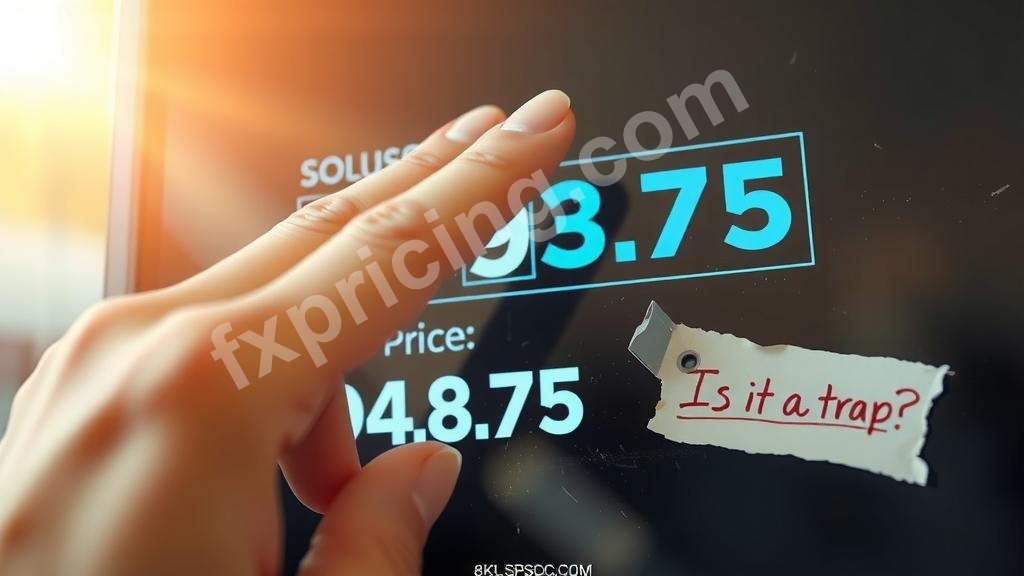
Okay, look, Solana is doing 93.875 right now, March 18, 2026. And the system flags a 'Weak Sell' signal. A 'Weak Sell.' Are you kidding me?
Because that just doesn't sit right when the actual price action is screaming "Bullish." It's one of those days where the numbers just don't want to line up, making every trade a puzzle.
The Battle of the Signals
Today, Solana's dropped a bit, opening at 94.617 and showing a -0.784% change. So, yeah, a 'Weak Sell' from that perspective makes some twisted sense, especially if you're only looking at the very immediate tick. But zoom out even a tiny bit, and the picture shifts entirely.
You see a 'Weak Sell' and you think, alright, maybe time to step back. But the underlying current feels different. It's like the market's trying to whisper something, and the official signal is just yelling static.
This kind of divergence, where the signal and the actual price movement feel like they're in a tug-of-war, that's what keeps traders up at night. Or, if you're me, it's what makes me wonder if I'm missing something obvious, or if the market is just messing with us.
Indicators Pointing North
Now, let's talk about the real muscle. Forget that 'Weak Sell' for a second. The oscillators and moving averages? They're practically throwing a party.
Take the Parabolic SAR, for example. It's at 84.9492 and calling out a "Strong Buy." Strong. Buy. Not weak anything. Then there's the ATR at 5.0977, also saying "Buy." Even the Ultimate Oscillator is just sitting there, completely "Neutral" at 53.0567, not even hinting at selling pressure.
And the moving averages? Good lord. The EMA 25 is 89.1022, "Strong Buy." The SMA 10 is 89.7604, "Strong Buy." SMA 25 at 86.5484, also a "Strong Buy." It's a chorus of bullishness, basically. So we've got a collective shouting match. One 'Weak Sell' against a symphony of 'Strong Buy's. I've lost money ignoring these clear signals before, trusting some gut feeling or a single conflicting data point. Solana price today feels like deja vu.
This is what I talk about on Fxpricing Blog. You get these wild, conflicting signals that make you question everything you thought you knew. Check out some more live data here if you want to see other pairs wrestling with this kind of stuff.
Resistance and The Bollinger Squeeze
So where does the price actually stand amidst all this? Solana is currently at 93.875. Let's look at the pivot points. The Classic Pivot is 94.9063, and the Woodie Pivot is 94.8315. We're just under both of those.
The resistance levels aren't far either: Classic R1 is 96.6307, Woodie R1 is 96.481. These are crucial levels. The 1M high was 97.666, so we're not far from making a run at those numbers again.
The Bollinger Bands also give us a peek. The Middle band sits at 86.5484. The current price position in the band is 93.45%, which is pretty high up there. And the squeeze? It's "Normal." No major expansion, no crazy tight contraction. Just a steady push. This usually means the underlying momentum is real, not just a brief flash.
A high position with a normal squeeze suggests continued upward pressure, or at least consolidation at elevated levels before another push. It certainly doesn't scream 'Weak Sell' to me, despite the small dip today. It makes me wonder what a truly strong signal would even look like if all these indicators are bullish.
The 6-Month Elephant in the Room
Let's not forget the elephant in the room though: Solana's 6-month performance is still down a whopping -62.0159%. That's brutal. So, while these current bullish indicators are strong, they're operating in the context of a long, painful downtrend.
This recent strength, pushing towards the 1-month high of 97.666, is a recovery. A fight back. It's not a market in an endless climb. The question becomes, is this 'Weak Sell' signal just a pause? A momentary gasp before the real move, either up or back down? My personal Solana forecast 2026? I think this weak sell is a head fake. The long-term performance makes any sustained bullish action meaningful.
The divergence between the immediate "Weak Sell" and the pervasive "Strong Buy" from almost every other indicator makes me cautious, but mostly, it makes me think. We are seeing a battle, that's for sure. For me, that 96.xx resistance level is the next big test. If it breaks, that 'Weak Sell' might just disappear in the rearview mirror.


