

The stock closed at 7.9 after opening at 7.61. Nearly four percent up. And still hovering 36 cents above the all-time low of 7.54. That's the kind of bounce that makes you check twice whether you're reading the chart right.
Alpha Dhabi Holding PJSC sits in a weird spot. The overall signal? Strong Sell. But it just posted a +3.811% session. You'd think a near-4% jump would flip some indicators, but look closer and the picture splits clean down the middle.
The Oscillator Contradiction
Parabolic SAR sits at 8.3923, which puts it above current price. That's a Strong Sell signal — the stop level is higher than where the stock trades. You're supposed to be out.
RSI clocks in at 35.6539. That's Buy territory. Not screaming oversold, but getting there. Two oscillators, two opposite conclusions. SAR wants you gone, RSI says there's room to bounce.
I've seen this setup before. Usually happens when a stock's been sliding for weeks and starts showing short-term relief while the bigger trend stays broken. The question is whether that relief turns into a real recovery or just another fake-out before the next leg down.
Moving Averages Tell One Story
SMA 200 at 10.4097. That's 2.5 points above current price, or roughly 32% higher. Strong Sell signal there too. The 200-day is supposed to be your long-term anchor, and Alpha Dhabi trades way below it.
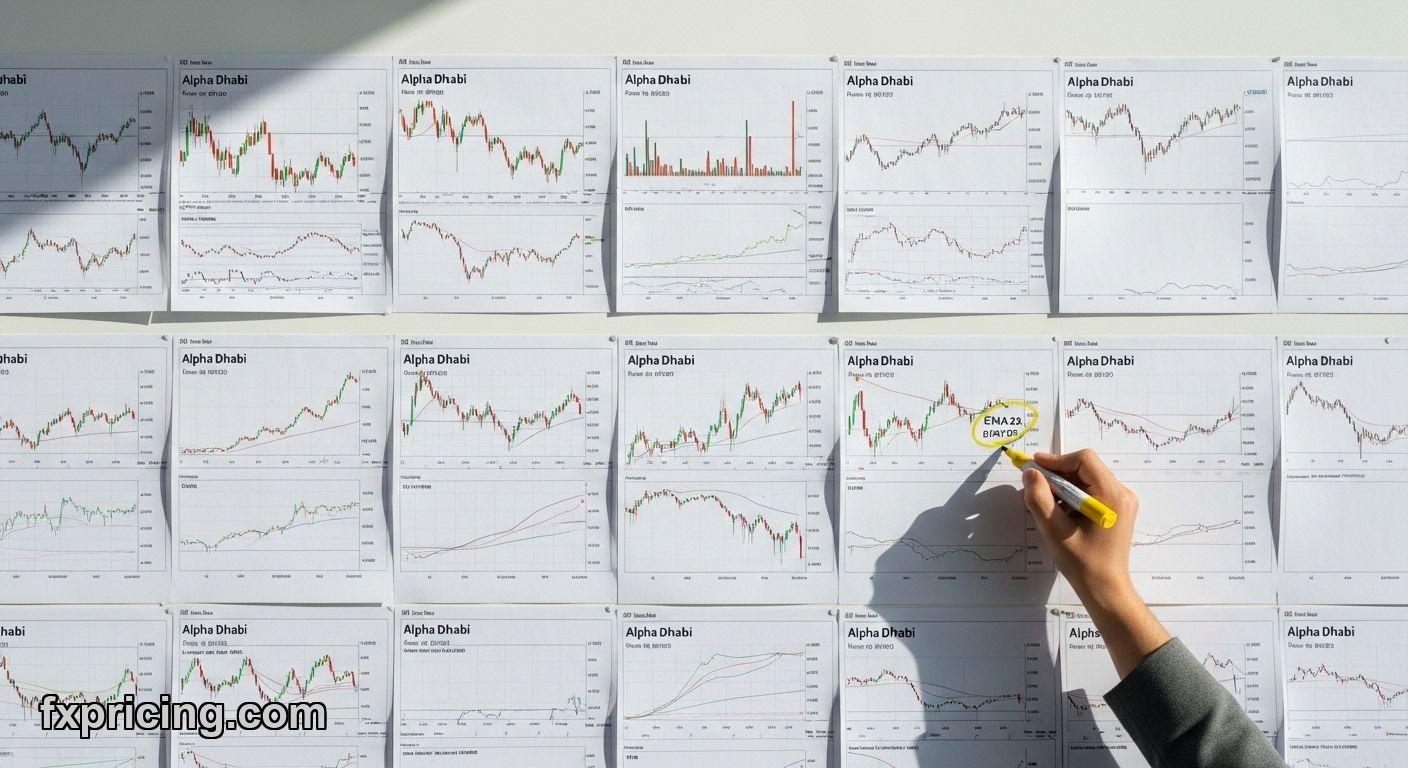
EMA 25 comes in at 8.63025. Still above current price by about 0.73 points. Another Strong Sell. Both moving averages agree — this stock is underwater on every meaningful timeframe.
When both the fast and slow averages sit above you, rallies tend to run into overhead resistance. That +3.8% move today? Could stall out fast once it approaches the EMA 25 level. The Stock — Equities data I check daily shows this pattern repeating across markets — stocks below their averages face selling pressure on every bounce.
The Six-Month Damage
Down 22.8516% over six months. That's not a correction, that's a busted trade for anyone who bought last fall. The one-week performance shows -1.86335%, which means today's gain barely scratched the recent slide.
Here's what bothers me: the all-time low was 7.54. We're at 7.9 now. That's a 36-cent cushion. Less than 5% of breathing room before the stock prints a new record low. And the UAE market doesn't exactly hand out participation trophies — if support breaks, it breaks hard.
I've watched plenty of stocks hover near their lows like this. Sometimes they bounce. More often they chop around for a while, bleed another 10%, and then everyone who "bought the dip" starts posting cope on forums about dollar-cost averaging.
What the Pivot Points Say
Demark pivot gives us R1 at 7.76, S1 at 7.32, pivot at 7.65. Current price 7.9 means we're above the first resistance. That's actually interesting — the stock pushed through R1 today, which could mean momentum is building.
But here's the thing: resistance at 7.76 is barely above the pivot at 7.65. Tight range. And support at 7.32 is uncomfortably close to that all-time low at 7.54. If the stock fails here and drops back toward S1, you're looking at fresh lows with nothing underneath.
Pivot points work until they don't. I use them for short-term levels, not as gospel. But when R1 and the pivot are bunched together like this, it usually means the stock is range-bound and lacking conviction. Nobody's stepping in with size.
The Strong Sell Signal Versus the Price Action
This is the head-scratcher. Overall signal: Strong Sell. But the trend is marked Strong, and price action is Bullish. How do you reconcile that?
Simple. The technicals are backward-looking. The moving averages, the SAR, the six-month performance — all of that reflects where the stock has been, not where it's going. Today's +3.8% is forward motion, but it's fighting against months of damage.
I don't trust one-day moves. I've been burned too many times buying a bounce only to watch it roll over the next session. But I also know that bottoms don't ring a bell. If Alpha Dhabi is actually turning, this is what the early stage looks like — weak bounce, terrible technicals, everyone still bearish.
That said, the RSI at 35.6539 is the only real Buy signal in this whole dataset. One indicator versus a pile of Sells. Not great odds. If you're thinking about jumping in because "it can't go lower," check the all-time low again. It went to 7.54. It absolutely can go lower.
What I'd Do
I wouldn't touch this with house money, let alone real capital. The Forex Rates and Crypto — Currencies markets have cleaner setups right now. If you're already in Alpha Dhabi, maybe you hold and see if it can reclaim that EMA 25 at 8.63. But buying here? You're catching a falling knife 36 cents above the all-time low with a Strong Sell signal glaring at you.
The gap between the RSI Buy and everything else screaming Sell tells me the market hasn't made up its mind. I'd rather sit this one out and watch. Let it prove it can hold 7.9 for more than a day. Let it break through 8.63 with volume. Then maybe. But today? No chance.


