

The chart doesn't lie. Amazon closed at $204.79 today, up 1.35% from the open, and every technical indicator screams the same message: stay away.
I've watched AMZN grind lower for weeks. The stock printed an all-time high of $258.60 not long ago. Now it's trading 20% below that peak with a signal score of -83.4—one of the most extreme readings I've seen on a large-cap name. That's not a dip. That's a breakdown.
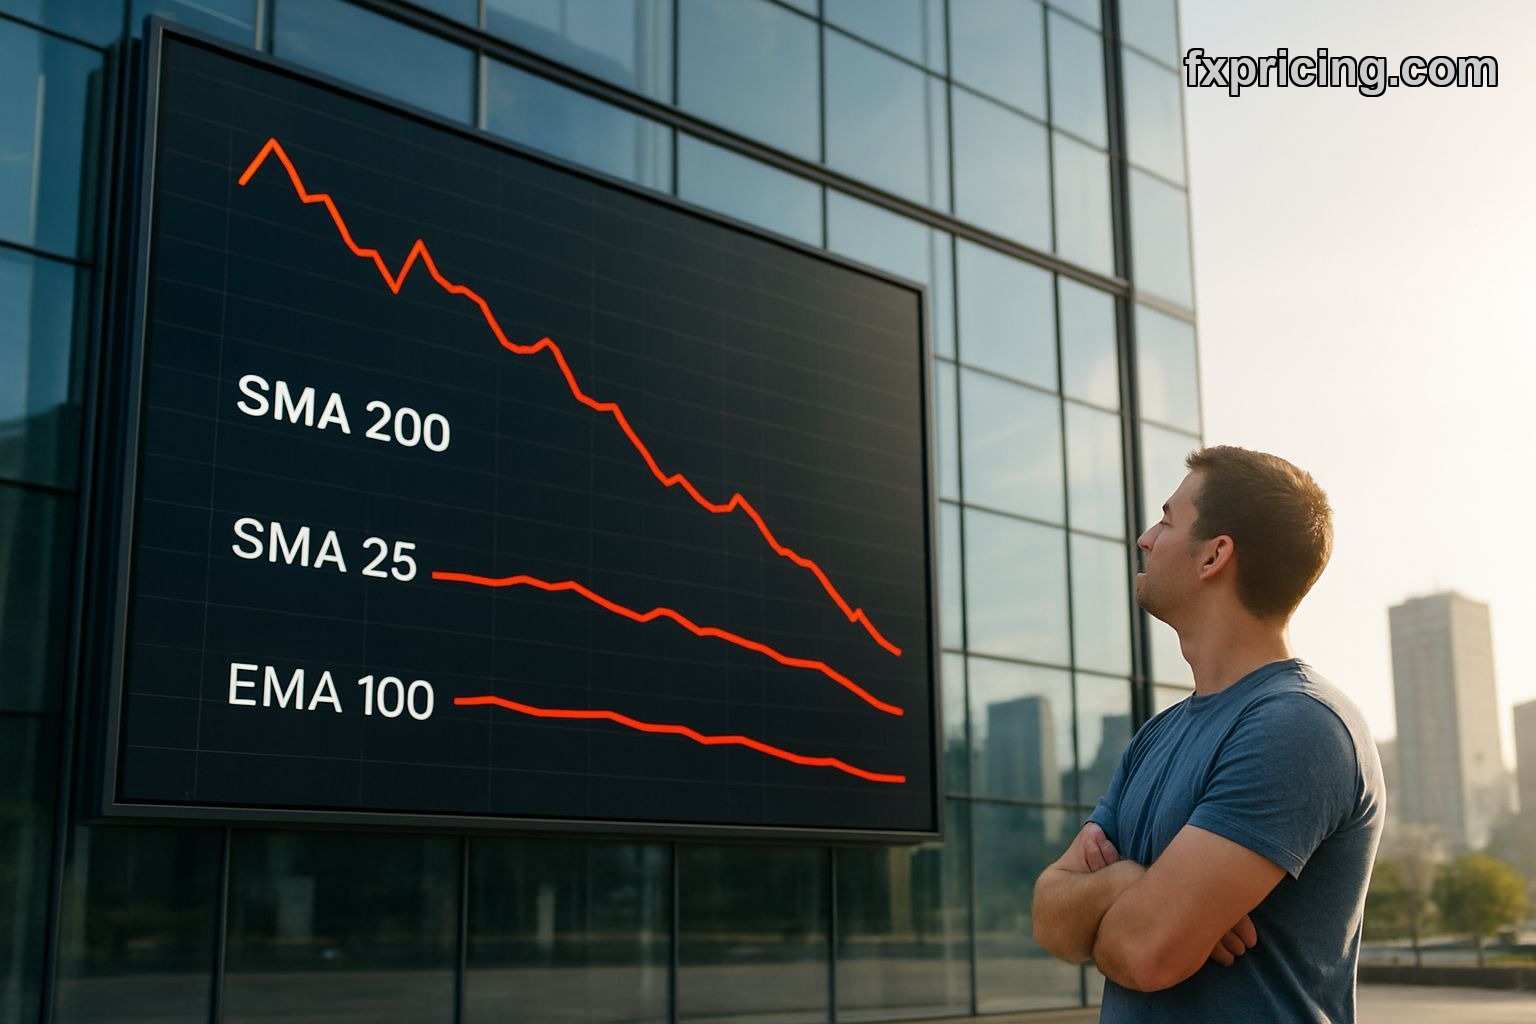
The Moving Averages Tell the Story
Three moving averages, three Strong Sell signals. The 200-day SMA sits at $223.78. The 25-day SMA is at $226.85. The 100-day EMA reads $227.23. All of them above current price. All of them acting as resistance.
When you're trading below every major moving average, you're not in a correction. You're in a downtrend. The market respects these levels, and right now Amazon can't break back above any of them. I tried catching this knife twice in January. Lost both times.
The Bollinger Band position confirms it—AMZN is sitting at just 16.25% of the band width, hugging the lower edge. The middle band matches the 25-day SMA at $226.85, acting as dynamic resistance. Every bounce gets sold into that zone.
What the Oscillators Actually Mean
Here's where it gets strange. The Stochastic K% dropped to 10.13, flashing a Strong Buy signal. Oversold territory. In theory, that should mean a bounce is coming. But oversold can stay oversold for weeks when the trend is this strong.
The ATR reads 7.06 with a Buy signal, but that's just measuring volatility—not direction. High ATR means big swings, and those swings have been mostly downward. Volatility doesn't care which way you break. It just tells you the ride will be rough. And it has been—ATR percentage at 3.51% confirms we're in a high-volatility environment.
I don't trade oscillators against the trend anymore. Learned that lesson the expensive way. Stochastic can print a buy signal all day long, but if you're trading against three moving averages and a -83.4 signal score, you're fighting the chart. The chart usually wins.
Pivot Points and Price Action
Camarilla pivots give us a tight range today—R1 at $201.68, S1 at $200.62, with a pivot at $201.15. We opened at $202.07 and pushed above that resistance to close at $204.79. That's bullish price action in isolation, but context matters. Woodie pivots show R1 at $204.02, which we barely cleared. S1 sits down at $198.28.
The one-week performance is negative—down 1.57%. So today's pop doesn't change the short-term picture. It's a bounce inside a downtrend, not a reversal. If you're tracking live stock market prices, you'll see these intraday rallies happen all the time in weak names. They don't stick.
The Real Problem With This Setup
Amazon is fighting both momentum and structure. Momentum is bearish—signal score, moving averages, trend classification all point down. Structure is broken—every rally gets sold at resistance levels that used to be support.
- SMA 200 at $223.78 is 9% above current price
- All-time high at $258.60 is 26% away
- Bollinger Band squeeze is normal, not expanding—no breakout brewing
- Trend classification: Strong (downward)
I'm not saying Amazon is going to zero. I'm saying the chart offers no reason to buy right now. You want to see at least one moving average flip, or price close above $210 with volume, or the signal score climb above -50. None of that is happening. If you're checking a free stock market widget and thinking about jumping in because it's "cheap," remember that falling knives look cheap too.
What I'm Watching Next
The $198 level from Woodie's S1 matters. If we break below $200 again, the next support cluster sits around $190. That's another 7% drop from here. On the upside, $210 is the first real test. Above that, you'd need to reclaim $215 to even start thinking about a trend change.
Stochastic is oversold, so a short-term bounce could happen. But oversold doesn't mean "buy." It means "be ready for a bounce that will probably get sold." I've been burned enough times buying oversold signals in strong downtrends. The trade works maybe 30% of the time, and when it fails, it fails hard.
The volatility gives you wide stops if you're trading this. ATR at 7.06 means a normal day can swing seven bucks. If you're wrong, you'll know fast. If you're right, the move won't be smooth. This isn't a stock you can set and forget right now.
My Take on the Signal
Strong Sell with a -83.4 score is aggressive, but it matches what the chart shows. I'm not shorting it here because we're deep in oversold territory and sentiment is already trashed. But I'm not buying either. There's no edge. The people who bought at $250 are underwater. The people who bought at $230 are underwater. The people who bought at $220 are still red.
Maybe this is the bottom. Maybe $204 is as low as it goes and we rip back to $230 by March. But I don't see the evidence yet. The setup favors waiting, not jumping in. When something wants to go down, it usually finds a way.
Amazon has been a monster stock for years. Made plenty of people rich. Right now it's not acting like a monster. It's acting like a stock that needs to base, digest losses, and prove it can hold support before anyone should get excited. I'll watch for that proof. Until then, every indicator on the Fxpricing Blog dashboard is telling me to stand aside.
So what would make you step in here—a moving average flip, a volume spike, or just blind faith in the name?


