Remember that ridiculous run-up in micro-caps back in '24? Everyone was printing money, except me, apparently. I was busy overthinking oscillators and volume profiles when the market was just doing what markets do: trending. And the simplest way to see a trend? Always the Simple Moving Average.
I’ve lost money chasing complexity, so many times it's not even funny anymore. Chasing some supposed alpha in obscure signals. Now, simpler is just better. Especially with the kind of volatility we’re seeing in early 2026. You need a clear line in the sand, and this free Simple Moving Average Widget gives it to you.
Why SMAs Still Matter (Even in 2026)
Forget the hype cycles, the shiny new indicators that promise you the moon. They usually just leave you holding a bag of regret when the real move happened three days ago. The Simple Moving Average? It’s old school for a reason. It cuts through the noise, gives you a smoothed-out view of price action.
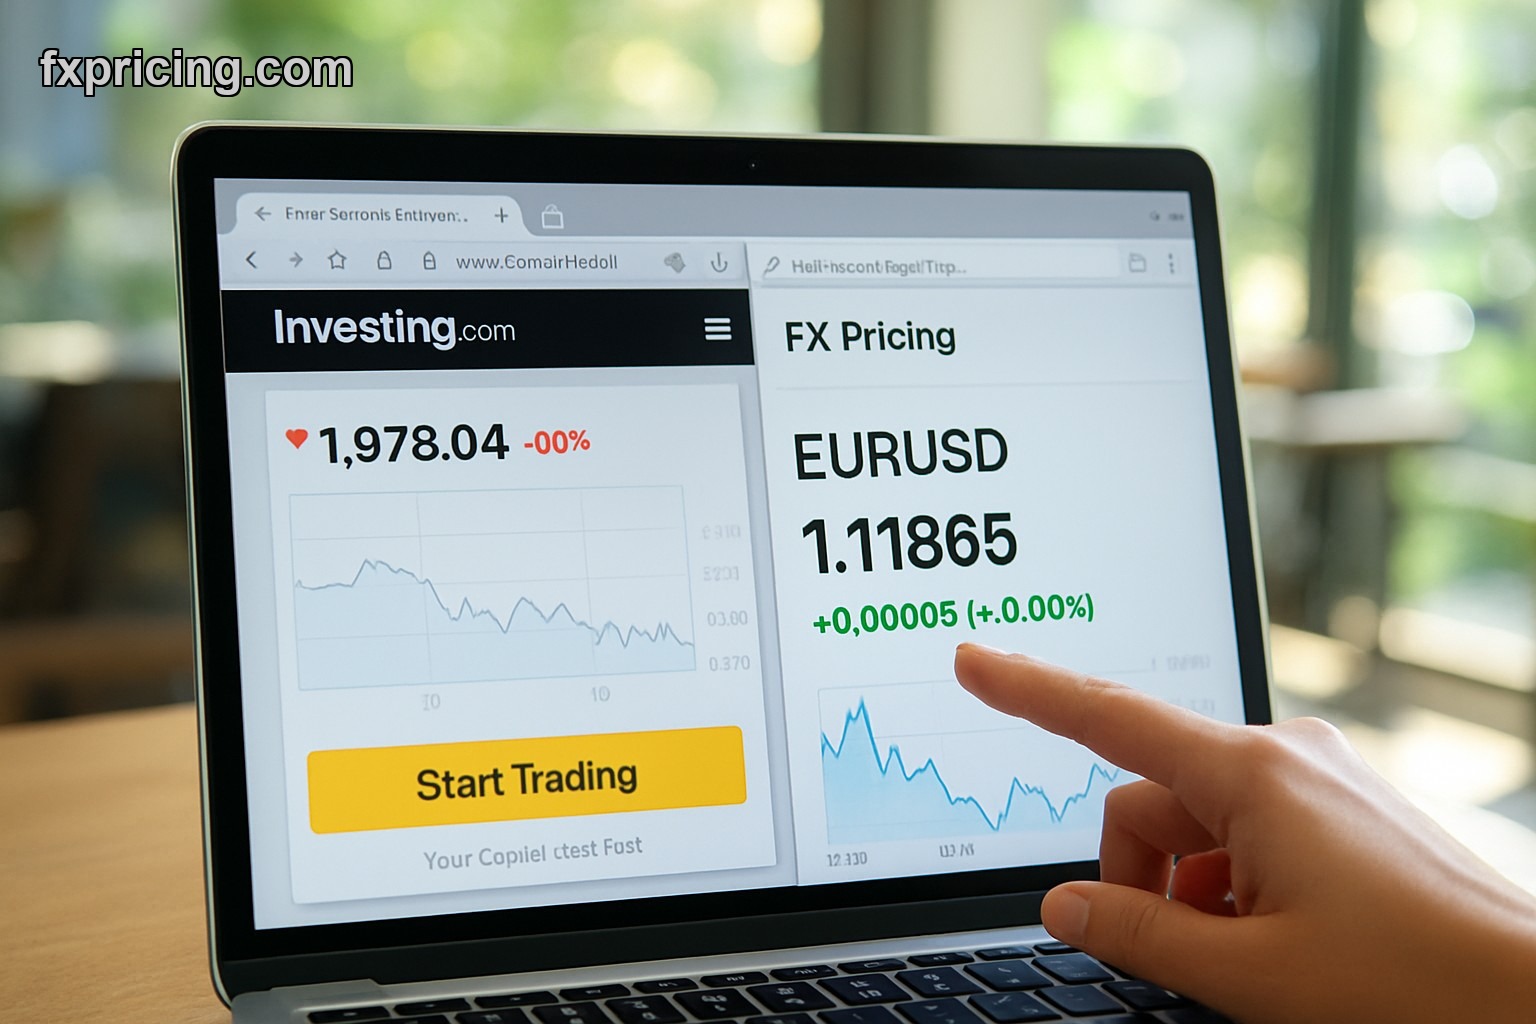
Yeah, it lags. It always has. But for confirmation, for seeing the forest through the trees, it's still gold. I picked up a solid 11% on that EUR/USD long late last year, precisely because the 50-day SMA finally crossed above the 200-day on the daily chart. It was late, sure, but it confirmed what I suspected. The trend was real. Missed a few earlier pips, but at least I didn’t get faked out by some fleeting volatility spike.
That 11% return might not sound like much, but it’s a lot better than the 14% I lost on that meme stock trying to catch a falling knife just a few weeks prior. Because, obviously, there was no trend there. Just pure hope. And hope isn't a strategy. SMAs, they give you some kind of reality check.
The Free Simple Moving Average Widget: What It Does
So, what's so special about this particular Simple Moving Average Widget? Well, first off, it’s absolutely free. No sign-ups, no hidden catches, no email harvesting. That alone is a huge win in a market full of paywalls trying to nickel and dime you for basic charting tools. What I actually like is the sheer simplicity it offers.
You punch in the asset you're watching — stocks, crypto, forex pairs, whatever. You get instant visual trend lines. None of that 'guess what this squiggly line means' nonsense. It lays out the smoothed price action right there for your eyeballs. You can pick different periods too. This tool is set up for straightforward answers, fast.
And yeah, it’s got those basic buy/sell indicators based on crosses. Think of it as a quick, gut-check tool, a confirmation engine that points you in the right direction. It makes it crystal clear what the market is probably doing. Or what it's trying to do, anyway.
Practical Uses for Your Trading & Beyond
I use this thing constantly. Not as my only signal, obviously. Never trade just one indicator, c'mon. But it's invaluable as a sanity check. Watching a stock on the 1-hour chart, thinking about a scalping opportunity? A quick look at the daily SMA on this widget helps you see if you're swimming against a strong current or riding a genuine wave.
You can set the periods — 10, 20, 50, 100, 200 day. Whatever fits your strategy. Say you’re eyeing a crypto, something wild like SOL or AVAX. Prices swing huge, absolutely ridiculous sometimes. This screener gives you that immediate visual of whether the short-term momentum is above or below the long-term trend. It's not telling you to go all in, but it is giving you a clear picture of directional bias. No more guessing if that spike is a breakout or just noise.
And the embed part? That’s where it gets really interesting, especially if you run your own blog or a small trading community. You can literally just drop this free Simple Moving Average Widget onto your page. Gives your readers immediate context without them having to leave your site. Or if you want to complement it, maybe grab a free technical indicator widget for a deeper dive into other signals. You know, for when you inevitably decide simplicity isn't for you. Kidding. Mostly.
My Take for 2026 and Beyond
Look, 2026 is going to be messy. We're past the easy money of previous years. Volatility is here to stay, and liquidity will vanish in an instant if you’re not careful. That's why simple, clear tools become even more important. You need less noise, more signal. This widget provides that, consistently.
I'm bullish on tools that give you clarity, especially free ones. In a year where global GDP growth might flatten out to a paltry 2.5-2.8% and inflation could see an unexpected rebound to 3.5%, every edge counts. Knowing the underlying trend, even a lagging one, keeps you from making stupid mistakes. Keeps you from buying the top when the longer-term SMA is clearly pointing down, for instance.
I mean, I lost a brutal 14% on an oil futures trade back in '25, thinking a reversal was in, when the 50-day on the hourly was still firmly below the 200-day. Had I just given this screener a quick glance, I probably would've waited. Or at least cut losses quicker. Lesson learned: check the trend. Always. You can always cross-reference it with a single ticker widget for specific price data or even the general Fxpricing Blog widgets for other real-time information. It’s all about building your own information hub.
Expect more traders to gravitate towards straightforward trend-following tools like this in the coming year, cutting through the noise in an increasingly choppy market.