26 indicators firing at once. That's the number this widget throws at you when you load it up. RSI, MACD, Stochastic, Bollinger Bands, a pile of moving averages — all condensed into three simple ratings: Buy, Sell, Neutral. No charts to stare at. No contradicting signals across five tabs.
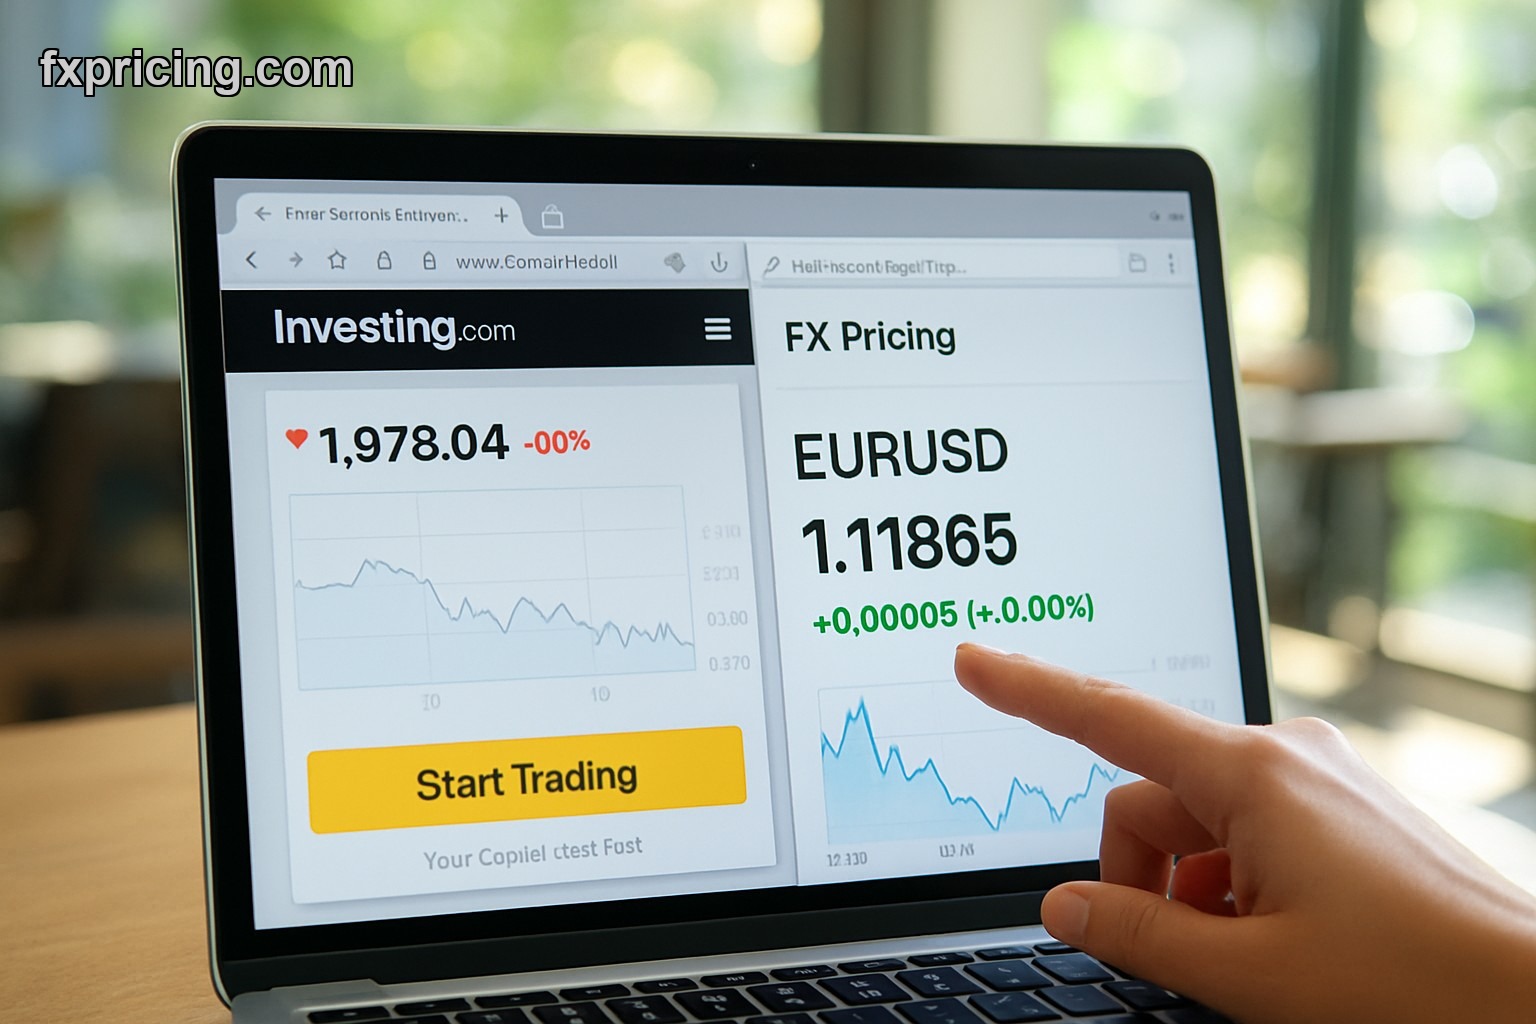
I've used this thing for six months. Mostly because I got tired of flipping between TradingView and my broker's platform just to see if momentum lined up with oscillators. The widget sits on my dashboard now. EUR/USD shows "Strong Buy" from moving averages but "Sell" from oscillators? I know the trend's intact but momentum's fading. That's useful.
What This Tool Actually Shows You
The widget pulls from 26 technical indicators and groups them into categories. Moving averages get their own section — exponential and simple, various periods. Oscillators like RSI and Stochastic get another. Then there's a summary rating that blends everything.
Each section displays a colored label: Strong Buy, Buy, Neutral, Sell, Strong Buy. Green when bullish signals dominate, red when bearish ones pile up. The widget updates live, not every five minutes like some tools that call themselves "real-time."
You pick the instrument — forex pairs, stocks, commodities, crypto. You pick the timeframe — 1 minute to monthly. The widget recalculates instantly. No page refresh, no loading spinner that takes fifteen seconds.
Features That Matter
- 26 indicators tracked simultaneously across moving averages and oscillators
- Real-time ratings that shift as price moves — no stale data
- Multiple timeframes from 1-minute scalping to monthly position trades
- Embeds on any site with a snippet — no API key, no backend setup
- Works on mobile without breaking the layout
The embed code is straightforward. Copy, paste into your HTML, done. I've dropped it on WordPress sites, plain HTML pages, even a Notion dashboard using an embed block. It loads fast. Doesn't bog down the page or throw CORS errors like some widgets I've tried.
How Traders Use It
I don't use this to make decisions. I use it to check if my read on a pair matches what technicals say. If I'm bullish EUR/USD and the widget shows 18 out of 26 indicators bearish, I double-check my thesis. Maybe I'm early. Maybe I'm wrong.
Some traders embed it on blogs or signal sites to show clients why they're taking a position. "Moving averages say Buy, oscillators say Sell, so we're waiting" — that's cleaner than explaining MACD crossovers and Stochastic overbought levels in a Telegram message.
Scalpers use the 1-minute and 5-minute timeframes. Swing traders stick to 4-hour or daily. The widget doesn't care. It recalculates for whatever you pick.
What It Doesn't Do
It won't explain why RSI is overbought or what a MACD divergence means. You get the rating, not the lesson. If you don't know what these indicators measure, the widget's just colored boxes. That's fine — it's not trying to be a tutorial.
It also doesn't predict. A "Strong Buy" rating can flip to "Neutral" in two candles if momentum shifts. I've seen it happen on GBP/JPY during news releases. The widget reacts to price, it doesn't forecast it.
No alerts either. If EUR/USD flips from Sell to Buy, you won't get a ping. You have to watch it. Some traders pair it with a ticker tape widget or single ticker widget to catch price moves faster.
Free and Zero Friction
No signup form. No credit card to "unlock premium features." The widget loads the same data whether you're a retail trader or running a fintech blog. I've tested it on high-traffic pages — never seen it throttle or show a paywall popup.
The design's minimal. White background, clean fonts, color-coded ratings. You can resize it to fit sidebars or full-width sections. It doesn't clash with most site themes. I've seen it on dark-mode dashboards and it still works, though the contrast isn't as sharp.
On Fxpricing Blog, we mention tools that solve actual problems. This one solves the "too many indicators, not enough screen space" problem. If you're already checking technicals manually, the widget just speeds it up. If you're embedding tools on a site, this one's lighter than most charting libraries.
Practical Embed Use Cases
Embed it next to a forex cross rates widget to show both price and technical bias. Or pair it with a pivot point widget to see if support levels align with bullish indicators. Some traders drop it on a second monitor so they don't have to alt-tab mid-trade.
I've seen signal providers use it on landing pages to justify their calls. "We went long EUR/USD because 22 indicators showed Buy" — whether that's good reasoning is debatable, but the widget makes the claim look less arbitrary.
For blogs covering daily market moves, it's a quick visual. "EUR/GBP technicals turned bearish overnight" — screenshot the widget, done. Faster than drawing lines on a chart.
When It's Actually Useful
Best use: confirmation. You've analyzed a pair, formed a view, now you check if technicals agree. If they don't, you think harder. If they do, you move faster.
Second-best use: client-facing dashboards. Clients don't want to learn what Stochastic means. They want to know if the position's still valid. Show them the widget. Green = still good, red = re-evaluating.
Worst use: blindly following the ratings. "Widget says Strong Buy so I'm going all-in" — that's how you get stopped out on a fakeout. The widget's a tool, not a strategy.
By mid-2027, most retail dashboards will have something like this baked in — indicators are too noisy to track manually, and AI summaries are still too slow for live trading.