Okay, so everyone's always chasing the next big indicator, right? "Is it RSI divergence? Is it the Ichimoku cloud crossing?" All this complex stuff, and traders lose their minds trying to combine twenty signals for one damn trade. But here’s the thing, the real secret? It’s often right in front of your face, so obvious, you just walk past it. the single most surprising data point out there isn't some fancy algorithm, it's just the last candle. That’s it. It tells you everything you need to know about the immediate sentiment. You get a ton of info, quick. And that's what the free Last Candle Widget delivers, pure and unadulterated.
Best Free Last Candle Widget 2026: The Truth About Simplicity
This little tool? It just screams instant insight. Everyone thinks you need elaborate setups. Nope. You just need to see where the market just was, right now. It's crazy simple how much you can learn.
Last Candle Widget for Website: Live Data Made Easy
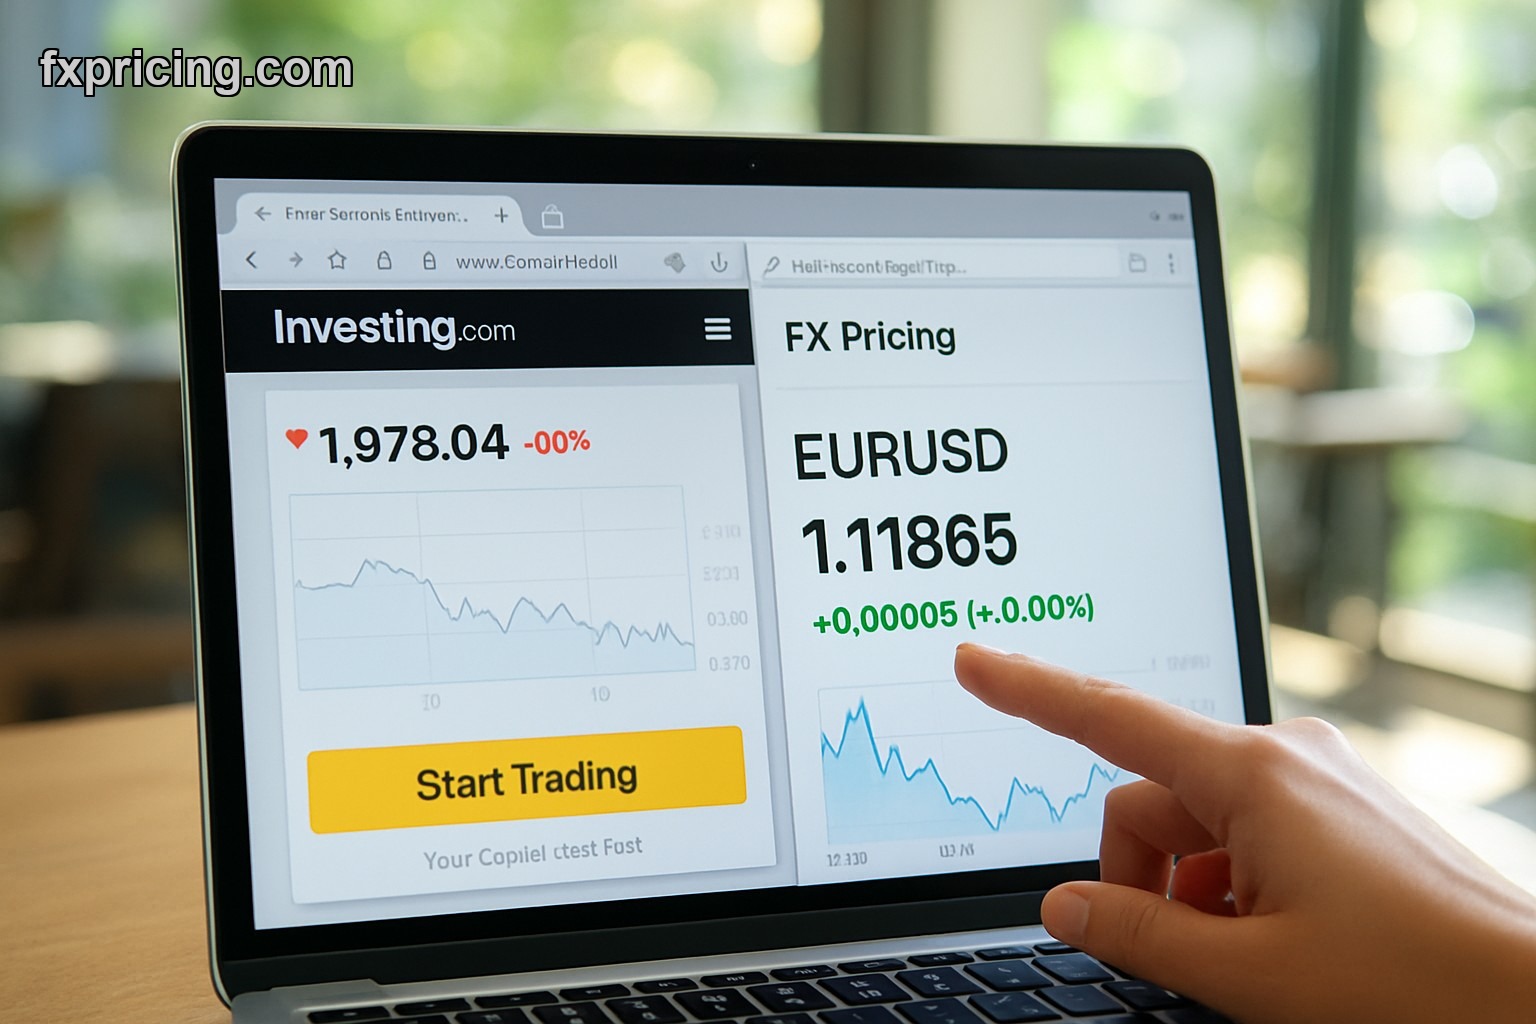
So what are we talking about here? It’s a tool that pops the latest forex candle data right onto your screen, or your website. Live prices, chart, table, whatever you need to see. You get the open, high, low, close for any pair. In real-time. This isn't some delayed feed, its fresh. You know how important that is. No signup needed, just grab the code and slap it on your site.
I mean, look. You're trying to figure out if EUR/USD is gonna bust through resistance or just bounce off it. That last candle shows you the immediate buyer/seller pressure. Is it a big wick to the upside? Bears pushed it down. Small body, closing near the high? Bulls are still in control. It's not rocket science, it’s just paying attention to what just happened. It lets you get a feel for the market vibe in an instant.
How to Embed the Free Last Candle Widget
Seriously, embedding this thing is child's play. You don't need to be a coding genius. Fxpricing made it stupid simple. You go to the page, pick your currency pair, time frame (like 5min, 15min, 1hr), maybe a few visual options if you're fancy. Then you copy the HTML. Paste. Done.
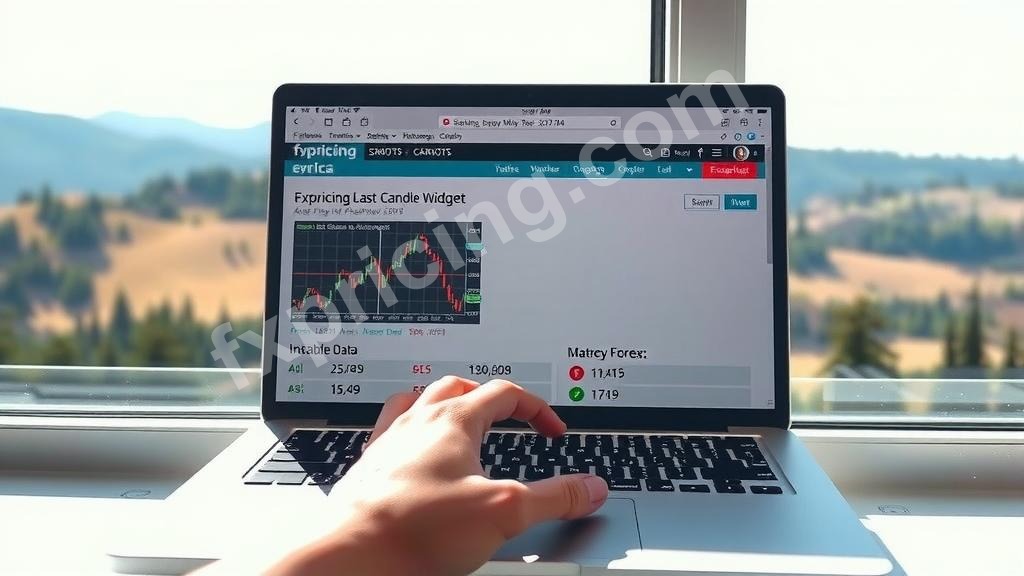
It automatically updates. no refreshing, no weird scripts you gotta run. It just sits there, ticking along, giving you the real-time prices. You can also snag other useful stuff, like a free technical indicator widget if you really need to complicate things.
I put one on my personal trading journal site. just for EUR/USD on the 15-minute. It's a quick reference point when I'm scanning other news, keeps me honest about immediate price action before I dive too deep into my complex analysis.
Free Last Candle Widget Online: Making Quick Decisions
This isn't just about pretty charts. This is about making decisions. And fast. Think about it: a big spike happens. Do you jump in? Or is it a fake out? The last candle tells you the momentum and strength, or weakness, of that move. if it closes strong, buy. if it retrace hard, probably a bad idea.
I made a stupid call once, thought GBP/JPY was gonna breakout from resistance. Bought it like an idiot. five minutes later, the candle reversed hard, big upper wick, closed red. Should've known right there. Got out with a small loss, thankfully. The widget would have slapped me in the face, saying "dude, don't be an idiot." it's like a tiny warning light for your trades.
- Fast Reference: See open, high, low, close for any selected timeframe instantly.
- Visual Clarity: Clear chart and table formats, so you can choose your poison.
- Embeddable: Put it on your blog, your trading dashboard, anywhere you need it.
- Completely Free: No hidden fees, no subscriptions. It's just there.
Last Candle Widget Live: Beyond the Basics
Okay, so it’s not going to replace your whole trading platform, obviously. But this thing compliments it. It’s for those moments you need to confirm something super quick. Is the market still bearish on this last move? Or are buyers starting to step in? That single candle answers that. No lagging indicators, no re-painting nonsense. Just raw price action.
Some people ignore this, they're too busy with complex strategies. But I always tell ya, master the basics first. Understand how price moves, then worry about your fancy stochastic oscillators. this tool helps you do exactly that, it’s a quick reality check. Even pivot points need to be interpreted against actual price action, and that's where the current candle matters most.
You can adjust the timeframe too. You're looking at a daily chart, but wanna see the very last hour's action? Switch it. Boom. Instant clarity. it's incredibly flexible. and that instant information is crucial.