You know that gut feeling? The one that screams "SELL!" on EUR/USD, and you click, then watch it spike right past your entry. Yeah, I’ve been there. March 10, 2026, started like any other Tuesday. I was still smarting from that crazy GBP/JPY move last week, another loss. Thought I had the whole market figured out.
Turns out, the market doesn't care what I think. But what if there was something that just.. told you? Something that felt wrong, totally against your intuition, but kept working anyway? That's kinda what happened when I started leaning on the free Forex Technical Indicator Widget. And it surprised the hell outta me.
The Weird Truth About "Strong Buy" on 15-Min Charts
Alright, so here's the kicker. The biggest, most counter-intuitive thing I've seen with this tool, and frankly, it still bugs me that it works so often: the "Strong Buy" signals on the 15-minute charts for certain major pairs, especially EUR/USD and AUD/USD. I'm talking about when everything else in my head says "this is a pullback, it's going to dive."
I'd see a "Strong Buy" pop up, right after a small dip, when the longer trend was still clearly downward on the H1 or H4. My brain would scream: don't do it, man, this is a trap. But then I'd take a small position, just to test it. And damn if it didn't push up, often for a quick 10-15 pips, enough to grab a profit and run. This wasn't some every-time magic bullet, but the hit rate was way higher than it had any right to be. It went against everything I thought I knew.
Most traders look for confirmation, right? Multiple indicators aligning. Me too, usually. But this particular quirk, this almost defiant "Strong Buy" on the 15-minute, for those two pairs? It’s been a recurring theme for me this year. It forces you to question your biases, to trust the raw output even when it feels like gambling. It's a real lesson in humility, I guess. The market doesn't care about your feelings, just the numbers. And these numbers, from this widget, sometimes speak a different language.
What This Tool Actually Does
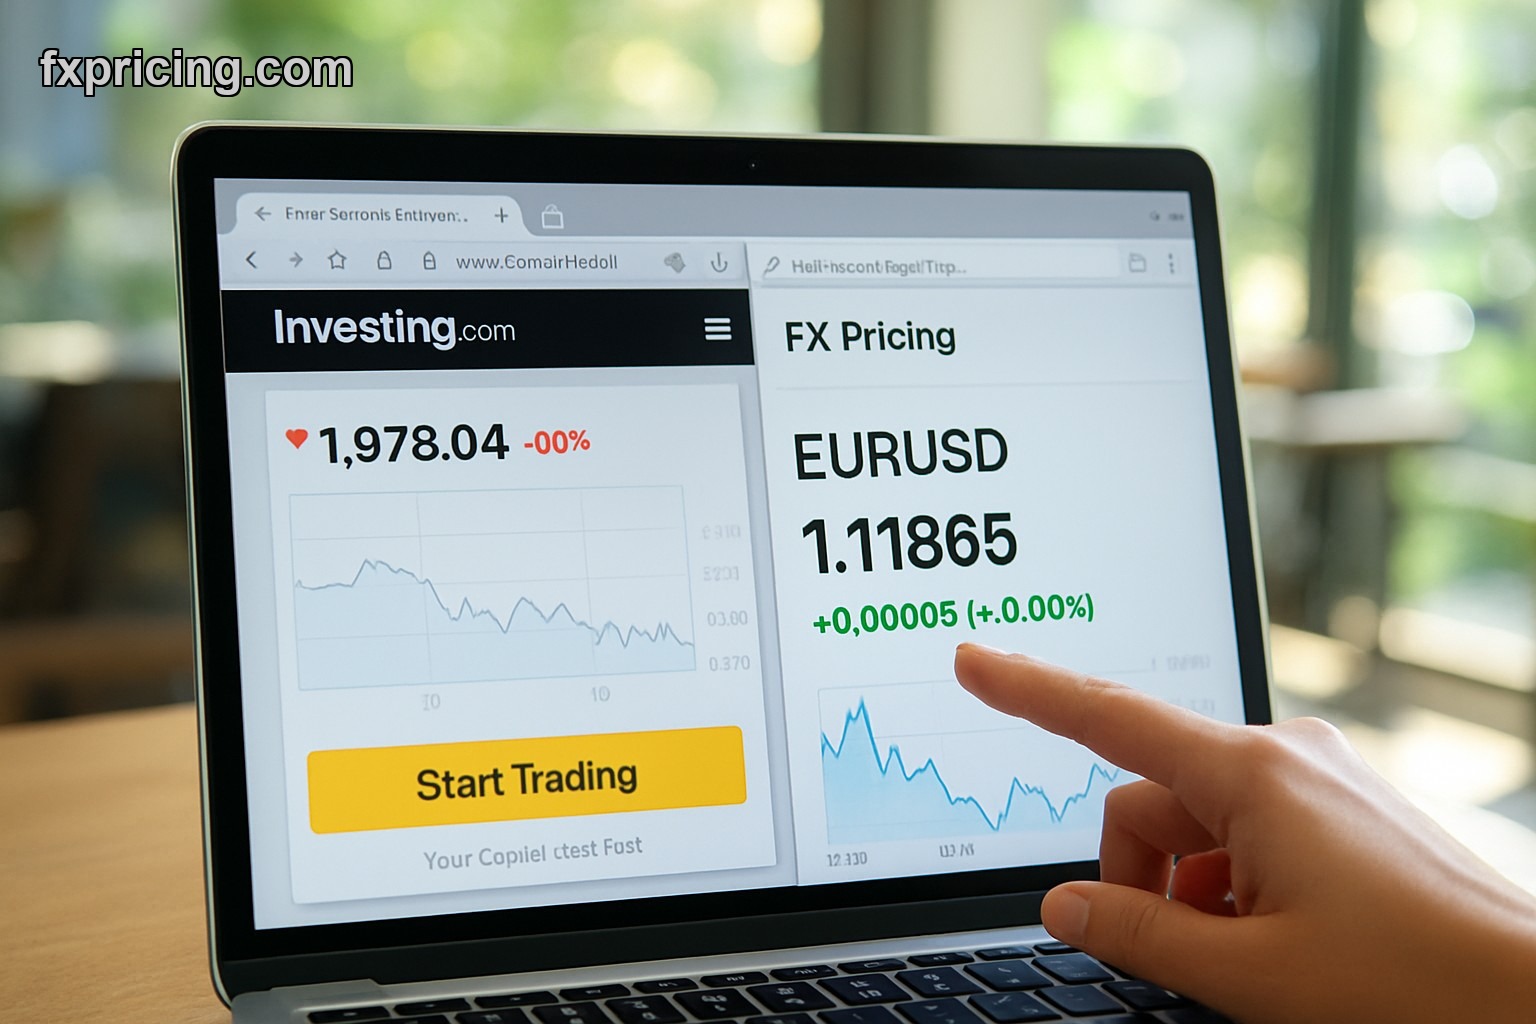
So, what is the Forex Technical Indicator Widget? It’s simple, really. It gives you real-time analysis ratings for financial instruments. No messing around with custom scripts or complicated setups. You pick your instrument – EUR/USD, Gold, whatever – and a timeframe, and it crunches the numbers for you. It pulls in data from a bunch of common technical indicators.
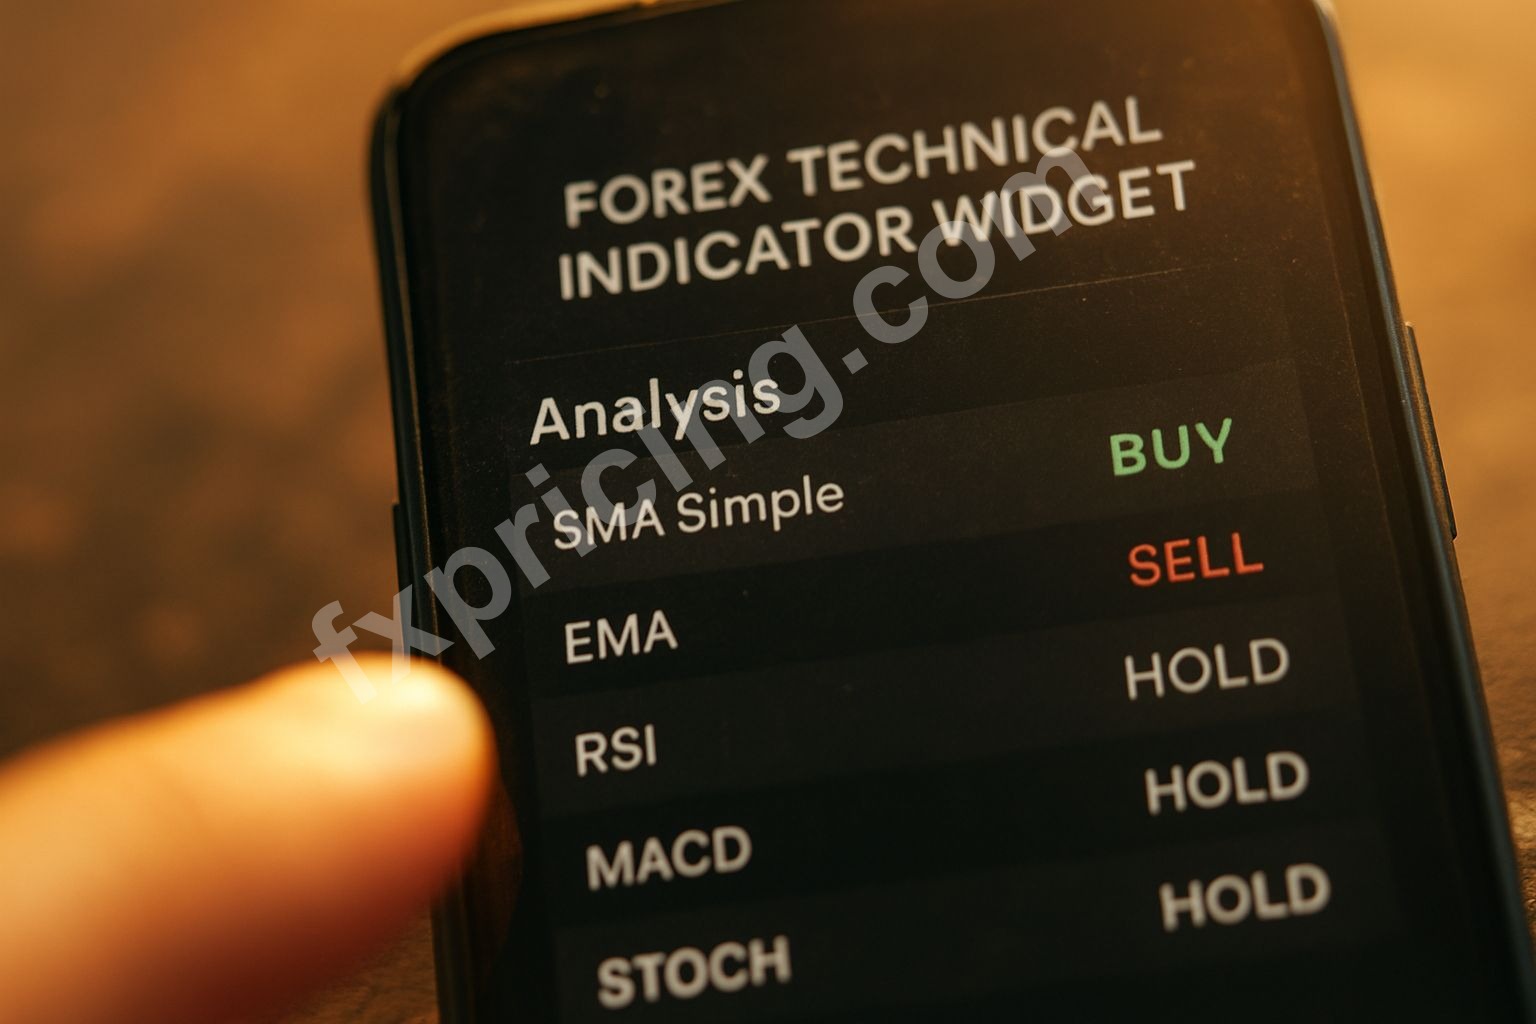
You get these clear ratings: Strong Buy, Buy, Neutral, Sell, Strong Sell. It's not just some random guess. It's taking all those squiggly lines you usually stare at on a chart, all those MACDs, RSIs, moving averages, Stochastics – and boiling it down. Makes it easy to get a quick read without having to calculate every single thing in your head, especially when you're flipping between charts.
The beauty? It's totally free. No signups, no "give us your email for a demo." You just use it. You can stick it on your own website, too. It’s pretty slick, actually. Find the widget here.
Here’s a snapshot of the types of analysis it covers:
| Indicator Type | Example Indicators | Analysis Provided |
|---|---|---|
| Moving Averages | SMA (Simple), EMA (Exponential) | Buy/Sell based on crossover and price relation |
| Oscillators | RSI, MACD, Stochastic | Overbought/Oversold, momentum strength |
| Volatility | Bollinger Bands | Price extremes, potential reversals |
How I Use It for Quick Scans and Confirmation
My typical morning routine now includes firing up a few tabs with this widget set to different pairs and timeframes. I'm talking about more than just finding those contrarian 15-min "Strong Buy" plays.
For example, if I'm looking at AUD/JPY and thinking about a short, I'll pop open the widget. I want to see if the overall sentiment on, say, the 30-minute or 1-hour chart is leaning "Sell." If it is, and my own analysis lines up, it's a good green light. Not a guarantee, never that, but good confirmation. It streamlines the whole process.
Sometimes, I'm just watching the market for opportunities, not necessarily having a trade idea yet. I can cycle through instruments quickly. USD/CAD on the 5-minute is "Strong Sell." Okay, worth a look. What's the context? Maybe it's hitting resistance. It just helps me filter the noise. You wouldn’t believe how much time you save not having to manually add all those indicators to every single chart just to get a quick vibe. It's all there, presented clean.
Beyond The Obvious: Embedding and Other Tools
One of the cool things about this, for someone like me who runs a small trading blog – not Fxpricing Blog, mind you, my own little corner – is that you can embed it. Like, seriously embed it. Takes two seconds. You just grab the code, paste it. Boom, live real-time analysis on your own site. It’s a no-brainer for adding value without any dev work.
Think about it. You've got your own trading thoughts, your market commentary. Why not give your readers a real-time pulse of the market? It just elevates your content instantly. And it's not the only free tool either. There are other ones, like a widget for pivot points, which are absolutely crucial for understanding support and resistance levels. You stack these things together, and suddenly your website is a hub.
Having that instant sentiment read, without having to dive deep into a charting package every single time, it’s powerful. It lets you focus on why the market is moving, not just what the indicators are saying. That’s where the real money is made, understanding the context. These tools just make the "what" part faster.
Catching Myself and Looking Ahead
I know I started rambling a bit there about embedding, but the core point remains: this widget, for all its simplicity, offers genuine value. That bizarre reliability of the 15-minute "Strong Buy" signal for particular pairs on a down-trending market? That's just one data point, one oddity I picked up. There are probably a hundred other little quirks traders are finding with it, on different instruments, different timeframes. That's the beauty of it. It's a lens.
It cuts through the noise. It challenges your assumptions. And yeah, it’s free. In a market where every other service is trying to nickel and dime you, that's refreshing. It’s a tool that just sits there, ready to give you an objective, distilled view of where the technicals stand. It’s like having a quick, unvarnished opinion from a seasoned analyst, without the analyst. And sometimes that opinion is precisely what you need to make a decision or, at least, question your own.
Expect more traders to integrate real-time technical analysis widgets directly into their workflows by the end of 2026.