
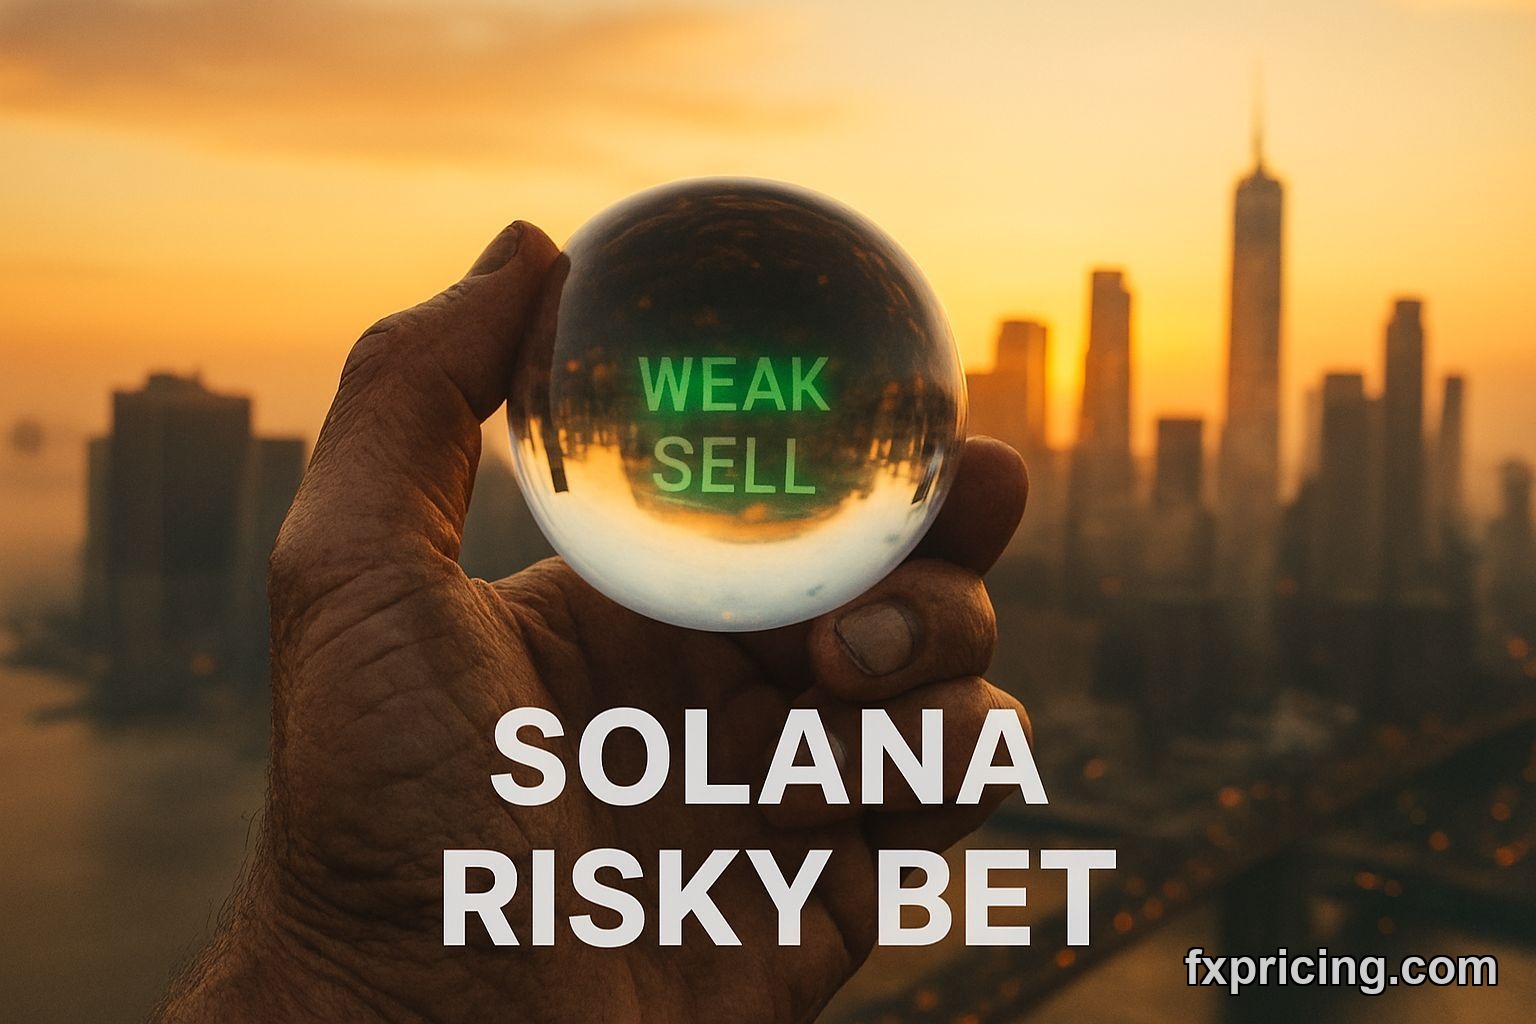
Today, March 11, 2026, Solana sits at 86.62. Just barely up, mind you, a paltry +0.853% from its open. What's truly staring us down, though, isn't the tiny green tick, it's the official "Weak Sell" signal score of -25.4. Doesn't exactly scream "time to empty the war chest," does it?
I mean, you got to wonder what's going on when the general signal is weak selling, but the price action for the day is somehow flagged as bullish. That's the kind of contradiction that should make your stomach clench a little. That's where the real risk lives, right in the cracks of these mixed messages.
Solana's Conflicting Readouts
Look, I've seen enough of these charts on Fxpricing Blog to know that when things don't line up, you better be extra careful. We have an Ultimate Oscillator screaming "Neutral" at 41.5728, which means nobody really knows what side is up. But then you’ve got the Parabolic SAR, bless its heart, flashing "Strong Buy" at 80.8419.
So, one part of the market says "meh," another shouts "buy buy buy," all while the overarching sentiment leans "Weak Sell." It's like three different people shouting directions at you in a burning building. You gotta pick one, and you better hope you pick right. For me, that level of disagreement just rings alarm bells, especially when we talk about a Solana forecast 2026.
There's money to be made, sure, but way more often, it's money to be lost when everyone's talking out of both sides of their mouth. Remember when I got burned chasing a "Strong Buy" on some obscure altcoin that had glaring resistance signals ignored by the hopium crowd? Yeah, me too. This feels eerily similar.
The Elephant in the Room: Overhead Resistance
Now, let's talk about the big, ugly beast. The 100-day Simple Moving Average (SMA 100) is sitting way up at 113.205. And the 100-day Exponential Moving Average (EMA 100) isn't far behind at 111.741. Both are registering as a "Strong Sell." Seriously, a strong sell. The Solana price today is barely touching 86.62.
That means there's a wall of sellers ready to dump if this thing ever gets close to those levels. That gap? It's huge. Moving from 86 bucks to over 110? That’s not a stroll in the park, especially with this overall weak sentiment. You think buyers are going to magically materialize and smash through that kind of resistance without some serious news or momentum? I don't.
You can call it a price target if you're optimistic, but I see it as a ceiling. A concrete, rebar-reinforced ceiling. We're well below it, and unless something fundamentally shifts, those averages are going to keep acting like magnets pulling the price down or, at best, preventing any significant breakout. Just because the day is slightly up doesn't negate the longer-term trend. The market shows a variety of live cryptocurrency prices, and this kind of divergence is common but dangerous.
Pivot Points and Past Performance
Looking at the pivot points, specifically Woodie, we've got a pivot (P) at 86.3485, and R1 at 87.846. Classic has P at 86.5023 and R1 at 88.1537. We're hovering just above the pivot, pushing slightly towards R1. If it breaks through R1, maybe there’s a short pop. But remember those SMA 100s? They loom large, not far beyond that first resistance.
And let's not forget where Solana's been. Its 1-month low was 75.674. That's a drop of over ten bucks in a short period. It can absolutely go south, and it can go south fast. The All-Time High? A staggering 295.11. Look at that number, then look at 86.62. That’s a climb. A truly monumental one. A lot of people are holding bags from that ATH, just waiting to get out.
So, you tell me. Are we building a base for a run back to some respectable level, or are we just seeing a dead cat bounce on a moderate downtrend? Bollinger Bands show a normal squeeze and the price at 59.96% of the range, so no big expansion or contraction there. Just… normal. Too normal for such conflicting signals, if you ask me. I look at live crypto trading pairs daily, and this specific SOL setup feels like walking on thin ice.
My Honest Take: Risk Outweighs Reward for Solana Analysis
Honestly? The Solana analysis right now paints a picture of substantial risk. You've got a "Weak Sell" signal that's heavily backed by those monstrously high 100-day moving averages. They're telling you the long-term trend is down, or at least, stalled significantly below past highs. The "Strong Buy" from Parabolic SAR is a short-term indicator, easily overshadowed.
Sure, today's positive change and bullish price action might tempt some, and that Ultimate Oscillator sitting neutral means there isn't a definitive immediate collapse. But it's that giant, unspoken resistance looming over 110 that really makes me nervous about any substantial Solana prediction for 2026. Chasing a +0.853% day when you have a 25.4 'Weak Sell' score and those overhead SMAs is, well, it's just asking for trouble. My gut says stay clear, or at least, play it super cautious. Not enough conviction here for a major move.


