
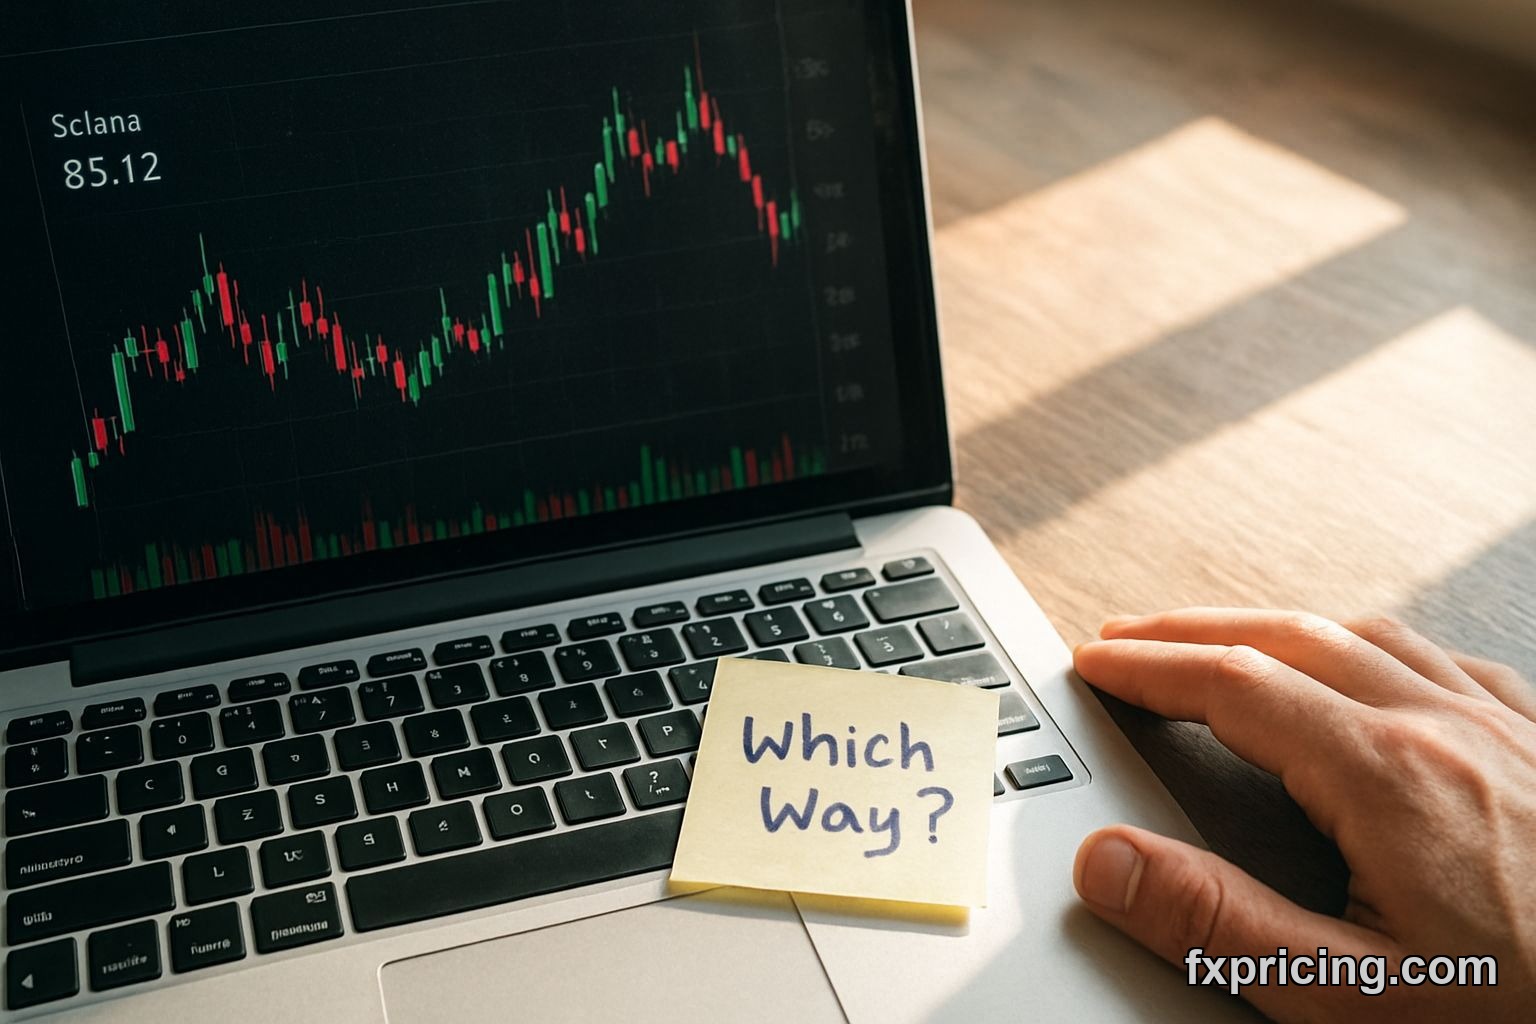
You ever stare at a chart, everything screaming one thing, but then the indicators, oh man, they're just.. whispering something else? That's Solana for me today, February 25, 2026. Up 8.411% right now, sitting at 85.588. Feels pretty good, right? A nice bounce after some tough weeks. Except the overall signal? It's a loud and clear Sell. Talk about a headache.
The Battle of Signals: Solana Today
Today’s action on Solana, it's gotta make you scratch your head. You see that price jump, more than eight percent, clear bullish price action. And then you look closer. My screen's telling me the EMA 10 is on a strong buy, MACD's even flashing a buy signal. Those are some decent green lights, if you ask me. I thought, "Okay, maybe we're turning a corner here."
But then, there's the big picture. The system-wide signal? A firm Sell, with a pretty deep score of -58.2. Not just a 'meh' sell, but a convinced one. And the SMA 25? That’s also sitting on a Sell. Even the SMA 100, way up there at 120.146, is a strong sell. It's like you've got three guys telling you to buy a house, but the inspector's got this grim look on his face, shaking his head. What do you trust?
I remember one time, late 2023 it was, I ignored a similar discrepancy with an altcoin. Price was up, everything felt bouncy. I went long, convinced the broader bearish signal was just lagging. It wasn't. Got absolutely crushed. Cost me a solid 15 grand before I pulled the plug. Sometimes the big signal knows something the smaller ones haven't caught onto yet. Or maybe, just maybe, it's totally wrong this time.
The 86-Dollar Resistance Zone for SOLUSD
Look, if you want a number to keep an eye on for Solana price today, it’s 86.0398. This isn't just some random spot. This is where the SMA 25 sits, and guess what? That’s also the middle band of the Bollinger Bands. It’s like a magnetic wall, right at Solana's current price. We're at 85.588 right now, just peeking under it. This isn't coincidence.
That 86.0398 level is the line in the sand. If we can get a sustained move above it, hold it, that would definitely put some more weight behind the bullish price action we're seeing. It means something. But if we bounce off it, if this rally fizzles right at that 86-dollar mark? Then that strong sell signal starts to look a whole lot smarter. It could turn into serious resistance.
This is where things get really interesting. Volatility is high, ATR% is 7.4956. So price can swing hard and fast. Getting a solid close above or below 86.0398 in this kind of environment tells you a lot about who's really in charge. Is it the bulls pushing through or the bears defending their territory with everything they've got? Check out all the live crypto trading pairs to see other coins grappling with similar levels.
Wild Swings and All-Time Highs
Solana's had a rough month, honestly. Just look at the numbers. Thirty days ago, it dipped to a 1M Low of 67.696. Then, a massive surge, hitting a 1M High of 128.11. That’s nearly double in just a few weeks. Now we’re sitting at 85.588. What a ride, eh? Not for the faint of heart, or for those of us who like some semblance of calm in our portfolios. It's a roller coaster that leaves your stomach in your throat.
And let's not forget the All-Time High of 295.11. We are nowhere near that. Not even close. It's a constant reminder of how much ground Solana has lost since its peak. This current price action, while technically bullish for the day, is just a blip in the grand scheme of things, still deep in bear territory if you look at the macro. It's good to keep perspective. This isn't a return to the glory days; it’s just a Tuesday bump.
This kind of volatility? It's a double-edged sword. Great for day traders, maybe. Terrible for anyone trying to build a long-term position without waking up in a cold sweat every morning. The market data, especially the one-month performance, really highlights the chaotic nature of assets like SOL. For those wanting to compare, you can always monitor the wider crypto market and its various currencies.
Pivot Points and Short-Term Boundaries
Now, let's talk about the super short-term. The Demark pivot points. They’re giving us an R1 at 81.221 and an S1 at 77.31. The Classic pivots are similar: R1 at 80.4627 and S1 at 76.5517. What does that mean? It means there are some immediate battlegrounds, both up and down, that traders are watching very closely. These aren’t long-term forecasts, but they definitely inform the intraday movement.
Given the price jumped almost 8.5% today, the fact that we're still seeing these lower resistance levels means any pullback could find support around these zones. Conversely, if it breaches them on the downside, things could get ugly fast. It's like navigating a small boat in choppy waters; you pay attention to every wave, not just the horizon. These micro levels, they matter, especially when the big picture is so unclear.
My strategy, especially with assets like Solana where things can turn on a dime, often involves watching these smaller patterns very closely. They can give you clues when the broader signals are contradictory. I’ve found that sometimes, these tiny support and resistance levels can be more actionable than the big, lumbering moving averages, particularly during highly volatile periods like we’re seeing today.
My Take: Solana Price Today and Its Outlook
So, where does that leave us with Solana price today, and for a Solana forecast 2026? It's a mess, frankly. A confusing, intriguing mess. You have genuine bullish momentum on the day, backed by some shorter-term indicators like the EMA 10 and MACD. The market just doesn't want to fall today. But you absolutely cannot ignore that overall "Sell" signal, or the fact that SMA 25 and Bollinger Middle are acting like an almost insurmountable barrier at 86.0398.
I wouldn't be jumping in with both feet right now, no way. This isn't a clear "Solana buy" signal, despite the intraday pump. It feels more like a trap, or at best, a short-term trading opportunity that could unravel just as quickly. You might catch a ride up to the low 90s, sure, if that 86-dollar level gives way. But then what? The next significant resistance, that SMA 100, is a long way off at 120.146. A very long way. That's a target that feels like a pipe dream.
For now, I'm watching that 86.0398 mark like a hawk. If Solana can decisively push through and hold it, then maybe, just maybe, we reassess. But until then, the smart money, or at least my money, stays on the sidelines or takes very small, nimble positions. This isn't about hedging; it's about not being an idiot. Sometimes doing nothing is the smartest move. It doesn't always have to be about making a trade, sometimes it's about not losing one. Especially when even Bitcoin, you can track it here at BTC-USD, sometimes struggles to find clear direction.


