
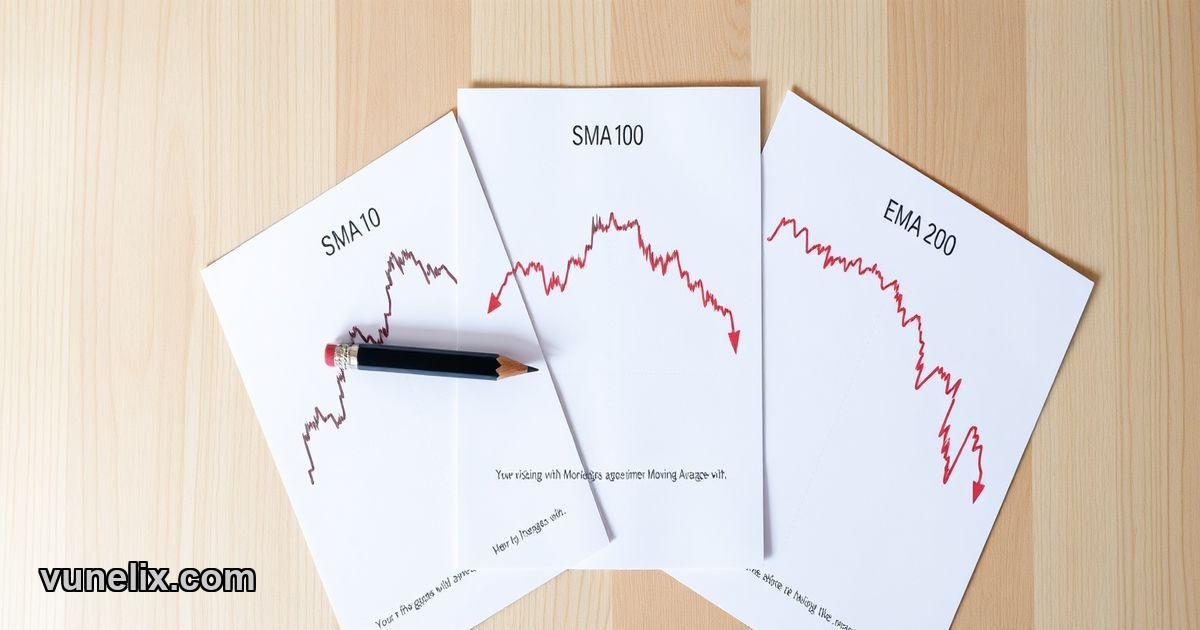
A doji candle at 8.5781 tells you one thing — indecision. The BRITISH POUND / DKX opened exactly where it's sitting now, April 2, 2026, with three moving averages flashing red and a Weak Sell signal nobody's talking about. When the 10-day SMA sits at 8.62493 and price can't touch it, that's not a pullback. That's rejection.
The signal score dropped to -18.7. Not catastrophic, but enough to make you think twice before entering long. MACD level at 0.0023 screams Sell, EMA 200 at 8.62353 also says Sell, and the 10-day simple moving average? Same story. Three indicators, one message. You can ignore one bearish signal. You can't ignore three. This is where AI forex trading tools become useful — they aggregate this mess into one clear view so you're not flipping between six charts trying to confirm what you already see.
BRITISH POUND / DKX Price Today: What the Numbers Actually Say
Price opened at 8.5781. Right now? Still 8.5781. Zero movement. That doji formation means buyers and sellers fought to a draw. When you see this after a 6-month performance of just 0.248925%, it's not a coiled spring ready to pop. It's exhaustion.
ATR sits at 0.0118 with a Strong Buy label, which sounds contradictory until you remember ATR measures volatility, not direction. Low volatility at 0.137% ATR means this pair barely moves — great for risk management, terrible for scalpers hunting quick pips. The 1-month low hit 8.5781 today. That's your support level, tested in real time.
Fibonacci Pivot Points All Land at 8.6062
R1, S1, and the pivot itself — all three clustered at 8.6062. When Fibonacci levels converge like this, it's either a major inflection point or the data's glitching. Price trades below this cluster right now. Break above 8.6062 and you've got room to run. Stay below and you're grinding against resistance that won't budge.
BRITISH POUND / DKX Buy or Sell: Breaking Down the Signal
Weak Sell doesn't mean panic. It means the path of least resistance tilts downward. MACD at 0.0023 is barely above zero but tagged as Sell — when momentum indicators this sensitive flip bearish, they're usually early. SMA 100 at 8.57076 shows Neutral, the only indicator not screaming direction. That's your floor for now.
The 10-day SMA gap is the problem. Price sits 46 pips below 8.62493. In a tight-range pair like this, that's significant. For context, the entire 6-month gain is 0.248925% — roughly 21 pips. So a 46-pip gap to the 10-day average is double the half-year move. You don't close that in one session.
BRITISH POUND / DKX Forecast 2026: Volatility Says More Than Price
Six months of sideways action, barely a quarter percent gain, and ATR% at 0.137 tells you this pair doesn't trend. It oscillates. Traders looking for BRITISH POUND / DKX prediction models need to adjust expectations — this isn't EUR/USD or GBP/USD where you get 100-pip swings weekly. This is a grind.
Performance metrics show the 1-month low matches today's price. That means we're sitting at the bottom of the recent range. Statistically, buying the low of a range works — until the range breaks and your support becomes resistance. The EMA 200 at 8.62353 acts as dynamic resistance. Price hasn't challenged it yet today.
Where an AI Forex Analysis Tool Free Scan Helps
Manually tracking three moving averages, MACD, ATR, pivot clusters, and performance windows across multiple pairs burns hours. An AI forex analysis tool free version lets you screen 100+ pairs with the same technical setup in seconds. Filter for "Weak Sell" signals, sort by ATR for volatility, flag doji patterns — done. FX Pricing depends on speed. You see the setup, confirm the bias, execute or skip. No thesis required.
BRITISH POUND / DKX Support Resistance Levels That Matter
Support: 8.5781 — today's low and the 1-month floor. Break this and there's no obvious catchment until the SMA 100 at 8.57076, just 7 pips lower. Thin margin.
Resistance: 8.6062 — the Fibonacci triple cluster. Then 8.62353 (EMA 200) and 8.62493 (SMA 10) stack just above. Three resistance layers within 50 pips. Breaking through that requires momentum this pair hasn't shown in six months.
BRITISH POUND / DKX Target Price: Realistic Expectations
If support holds and price reverts to mean, 8.62 is the first realistic target. That's 42 pips, about 0.49% — double the entire 6-month gain. Overly optimistic given the current signal. Downside target? 8.57076 if 8.5781 fails. That's another 7 pips, roughly 0.08%. Risk/reward doesn't favor longs here.
The Weak Sell signal with a -18.7 score isn't begging you to short aggressively. It's saying "don't buy yet." There's a difference. When three moving averages point down and MACD confirms, waiting is the trade.
BRITISH POUND / DKX Outlook: What Happens Next
Doji candles resolve — usually in the direction of the prevailing trend. The 6-month trend is flat with a microscopic upward bias. But shorter timeframes show bearish structure. EMA 200 and SMA 10 both declining, price below both. Until something changes, sellers control the near term.
ATR's Strong Buy rating means volatility is picking up even if price isn't moving yet. That's often the precursor to a breakout. Which direction? The signal says down. The support level at 8.5781 will tell you if it's real or noise.
I wouldn't touch this long until price reclaims 8.62 with volume. Short below 8.5781 with a tight stop at 8.58, targeting 8.57. But honestly, there are better setups out there today.
Explore more tools and market data on Fxpricing.