

The signal says exit. The price action says hold. BNB closed today at $645.99, down nearly 1% from an open of $652.41, and the technical indicators are screaming in opposite directions. This isn't a clean setup.
Strong sell signal meets bullish price action. That's the core problem right now. The oscillators and moving averages are pointing down hard, but the trend structure itself hasn't broken yet. When you see this kind of split, one side usually wins fast — and lately, the signals have been right more often than the candles.
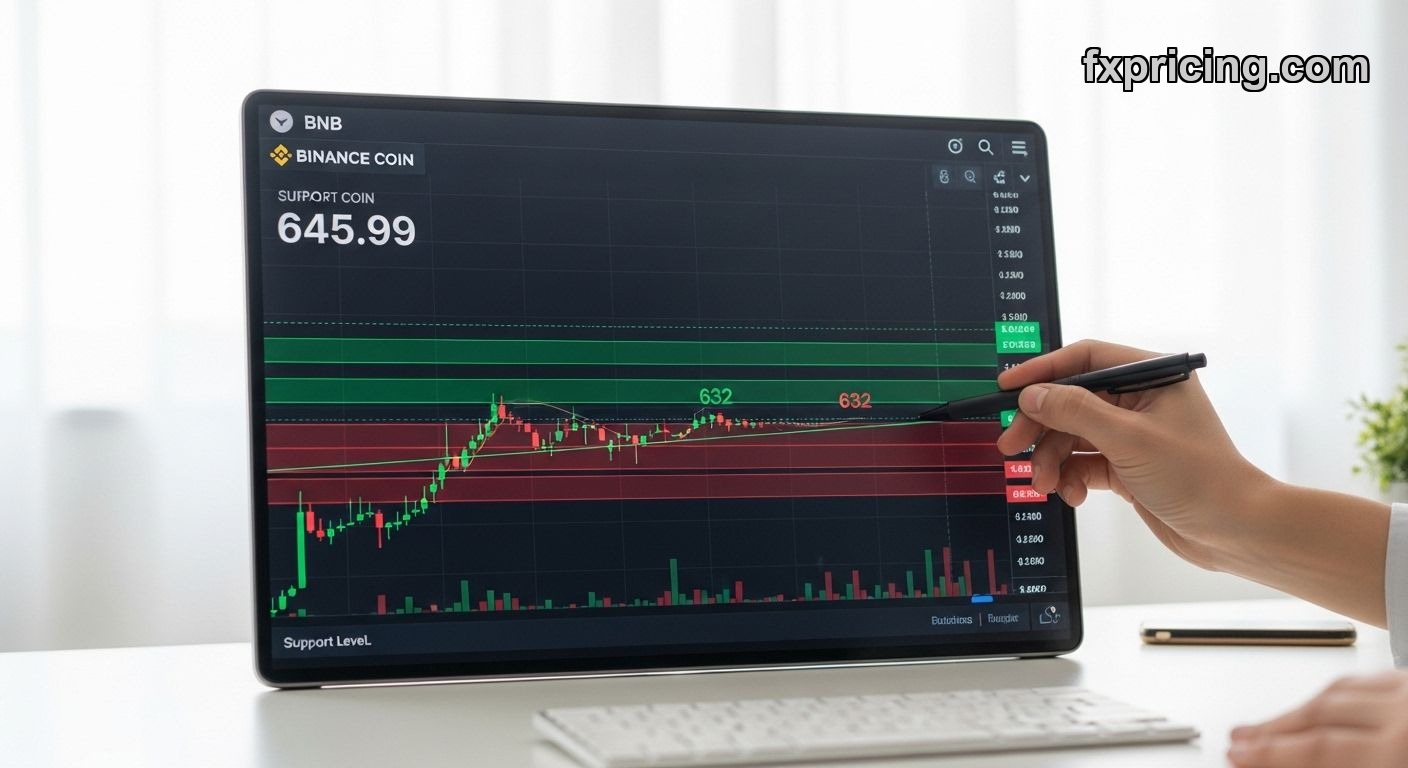
BNB Price Today and What the Numbers Show
Current price: $645.99. That's sitting above the middle Bollinger Band at $637.38, which means BNB is still trading in the upper half of its recent range. The position reads 60.66%, not extreme but leaning bullish. Problem is, the 10-day simple moving average sits at $657.95. Price is below it. The 100-day SMA is way up at $768.17. Both moving averages signal strong sell.
The Stochastic K% oscillator is at 60.19 — neutral zone, but the signal attached to it says sell. ADX is at 23.11, which technically signals strong buy for trend strength, but it's borderline. Anything under 25 is considered weak trend territory. So even the "strong buy" indicator here isn't that strong.
Volatility is high. ATR percentage is 3.70%, meaning BNB is swinging hard intraday. That's not unusual for crypto, but it does mean stop losses get hit easier and breakouts can fake you out faster. Check out live cryptocurrency prices if you want to track how BNB moves compared to other altcoins in real time.
BNB Buy or Sell: The Signal vs Price Action Problem
Here's where it gets messy. The overall signal is strong sell. But the price action reads bullish. Candle pattern is normal — no reversal flags, no exhaustion wicks. The trend is labeled moderate, not broken.
This divergence happens when momentum is fading but structure hasn't cracked yet. You're in that zone where sellers are getting louder, but buyers haven't given up the fight. One side breaks soon.
Pivot points give us some clues. Demark resistance 1 is at $664.46. Support 1 is down at $632.40. The pivot itself sits at $654.52. Right now BNB is trading below that pivot, which tilts the bias bearish short-term. If price can't reclaim $654 and push toward $664, the next stop is probably $632.
BNB Support Resistance Levels That Matter
- Resistance: $657.95 (SMA 10), $664.46 (Demark R1), $768.17 (SMA 100)
- Support: $637.38 (Bollinger middle band), $632.40 (Demark S1), $577.08 (1-month low)
The $632 level is critical. That's where Demark support sits, and it's not far from the recent low of $577. If BNB slips below $632, the door opens to a retest of that monthly floor. On the flip side, a clear break above $657 would invalidate the strong sell signal and suggest the bulls are back in control.
BNB Forecast 2026 and the 6-Month Picture
Six-month performance is down 34.29%. That's a brutal slide. BNB hit lows under $0.03 back in its early days, but the recent 1-month low of $577 is what matters now. The all-time low of $0.023 is ancient history — irrelevant for current trading.
What's relevant: BNB has been in a downtrend for months, and today's price action isn't showing any signs of a sustained reversal yet. Bullish candles don't mean much if they're printing below key moving averages and pivot levels. You need confirmation — a break above $664, then $700, before you can call this a turnaround.
For anyone tracking multiple assets, live crypto trading pairs can help you see how BNB is moving relative to Bitcoin and Ethereum. Sometimes altcoins recover when BTC leads, sometimes they lag. Right now, BNB is lagging.
BNB Analysis: What Happens Next
Two scenarios. First: BNB breaks below $632 in the next few sessions, confirms the strong sell signal, and tests $577 again. That would match the momentum indicators and the moving average setup. It's the path of least resistance right now.
Second: BNB reclaims the pivot at $654, pushes through $664, and flips the narrative. That would require volume, probably a broader crypto rally, and a clear shift in sentiment. Possible, but not what the data is leaning toward today.
The Bollinger Bands show normal squeeze, not tight or wide. That means no big expansion move is imminent. Expect chop, not a clean directional run. High volatility keeps things noisy.
BNB Outlook: Should You Hold or Exit?
If you're long from lower levels, you're still in profit depending on your entry. But the technical setup is deteriorating. The signal is clear: exit. The price action is giving you one last chance to get out near $645 before the next leg down starts.
If you're thinking about entering here, wait. Don't buy into a strong sell signal hoping for a bounce unless you see confirmation above $664. Trading against the indicators works sometimes, but it's not the high-probability play.
Fxpricing gives you real-time crypto data across dozens of pairs. Use it to compare how BNB is performing against Bitcoin, which is still the market leader. If BTC starts breaking down, BNB probably follows. If BTC holds, BNB might stabilize near $632 support.
Watch the $632 level. That's the line. Below it, things get ugly fast. Above $664, maybe we get a relief rally. Right now, the data says don't fight the signal.


