

Bitcoin sits at $68,052 this morning — up 0.29% from yesterday's open — but the signal sitting underneath that green tick is screaming the opposite direction. Strong Sell. Not "maybe consider lightening up" or "watch closely." Sell.
The confidence rating is medium, which means the model isn't guessing. It's reading price action that contradicts momentum across every timeframe. And when you look at the moving averages, you see why.
Bitcoin Price Today: The Moving Average Problem
Three exponential moving averages matter here. The 10-day EMA sits at $69,815. The 100-day is at $78,213. The 200-day? $86,511.
Bitcoin is trading below all three. That's not a dip — that's a downtrend with structure. When price closes under the 10-day EMA, short-term momentum died. When it's under the 100-day, the intermediate trend flipped. Under the 200-day means the long-term bias is bearish. Bitcoin checked all three boxes.
The signal score of -99.7 confirms it. That's near the floor of the scale. For context, anything below -50 is already bearish. This is twice that.
Bitcoin Buy or Sell: What the Oscillators Say
ADX reads 19.05, which should signal strength — and it does, technically, with a "Strong Buy" label. But ADX measures trend strength, not direction. A reading under 20 usually means no clear trend at all. So that "Strong Buy" tag is misleading here. There's no momentum behind it.
RSI at 43.97 is neutral, leaning toward oversold but not there yet. It's stuck in no-man's-land. Not bouncing, not crashing — just drifting lower. That's actually worse than a sharp drop because it signals indecision, not capitulation.
ATR sits at 2,729 points, which translates to 4.02% daily volatility. That's high, but not panic-level. It means the range is wide enough for both big wins and big losses. In a Strong Sell environment, that usually tilts toward the latter.
Bitcoin Support Resistance Levels You Need
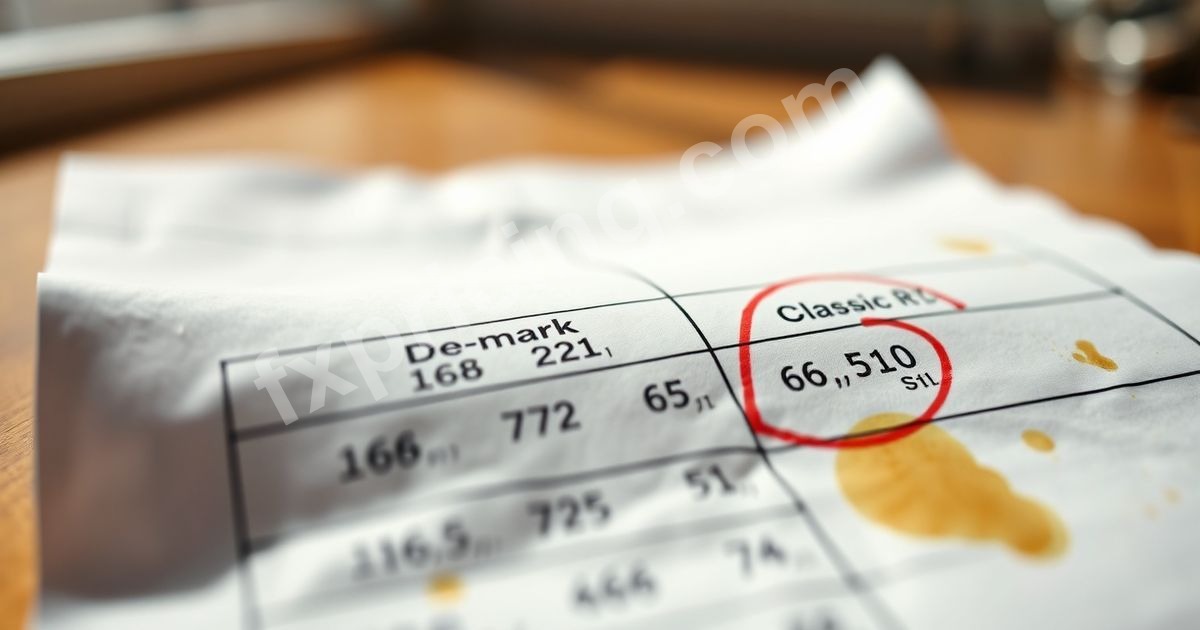
Demark pivot points offer the cleanest picture. Resistance 1 is at $68,722 — just $670 above current price. Support 1 sits at $66,510, about $1,542 below. The pivot itself is $68,042, which Bitcoin is barely holding above.
Classic pivots put R1 at $69,176 and S1 at $66,964. Either way, the upside room is tight. The downside has more space to run.
Bollinger Bands show Bitcoin trading at the 23.48% position within the band range — meaning it's closer to the lower band than the middle. The middle band is at $69,605, which aligns with that 10-day EMA resistance zone. If Bitcoin rallies, it hits a wall of overhead supply around $69,600 to $69,800. If it drops, the next real support is mid-$66,000s.
Bitcoin Forecast 2026: The Six-Month Collapse
Six months ago, Bitcoin was trading 39% higher. That's not a correction — that's a structural breakdown. The all-time high of $126,230 happened in the past year, and Bitcoin has since lost 46% of that value. That's bear market math.
The one-week performance is down 6.41%. That's a red week in a red month in a red quarter. No bounce yet. Just steady bleeding.
If you're watching live cryptocurrency prices on other assets, you'll see Bitcoin leading the way down — and when Bitcoin falls, altcoins usually follow harder. That's been the pattern since the peak.
Bitcoin Analysis: Why This Isn't a Buy the Dip Setup
A dip implies price pulled back within an uptrend. This isn't that. Bitcoin is in a confirmed downtrend with no technical evidence of a reversal. The 10-day EMA is sloping down. The 100-day EMA is sloping down. The 200-day EMA is sloping down. All three are stacked in bearish order — shortest on bottom, longest on top.
That's textbook trend structure, and it says one thing: sellers are in control.
The Bollinger Band squeeze reads "Normal," which means volatility hasn't compressed yet. When it does, that's usually when the next big move happens. But in a downtrend, the breakout direction tends to follow the path of least resistance — which right now is down.
Bitcoin Target Price: Where This Goes Next
If Bitcoin breaks $66,510 — the Demark S1 level — the next support zone is around $64,000 to $65,000. That's where the September 2024 lows printed, and it's also a psychological level. Below that, you're looking at $60,000.
On the upside, Bitcoin needs to reclaim $69,600 (the Bollinger middle band and 10-day EMA) and hold it for more than a day. Then $70,000 becomes the next test. But that's a lot of "ifs" when the signal is this clear.
If you're tracking Bitcoin to US Dollar pairs across exchanges, you'll notice the same structure everywhere. This isn't an isolated chart pattern — it's consensus.
Bitcoin Outlook: What Happens If You Ignore the Signal
I've ignored Strong Sell signals before. Twice it worked out because some external headline flipped sentiment overnight. Four times it didn't, and I rode positions down another 10% to 15% before finally cutting. The math doesn't favor ignoring this.
The signal isn't saying Bitcoin goes to zero. It's saying the risk-reward right now is terrible. You're buying into overhead resistance with no momentum support and a trend that's been bearish for six months. That's not a trade — that's hope.
If you want to track this in real time, Fxpricing has tools that update every few seconds. The free crypto widget lets you embed live prices on your own site, so you're not refreshing charts all day. I use it because I got tired of juggling three browser tabs just to see if a level broke.
What I'm Watching Next
The 10-day EMA at $69,815 is the first test. If Bitcoin closes above that and holds it for two consecutive days, the signal might flip to neutral. Until then, the path of least resistance


