
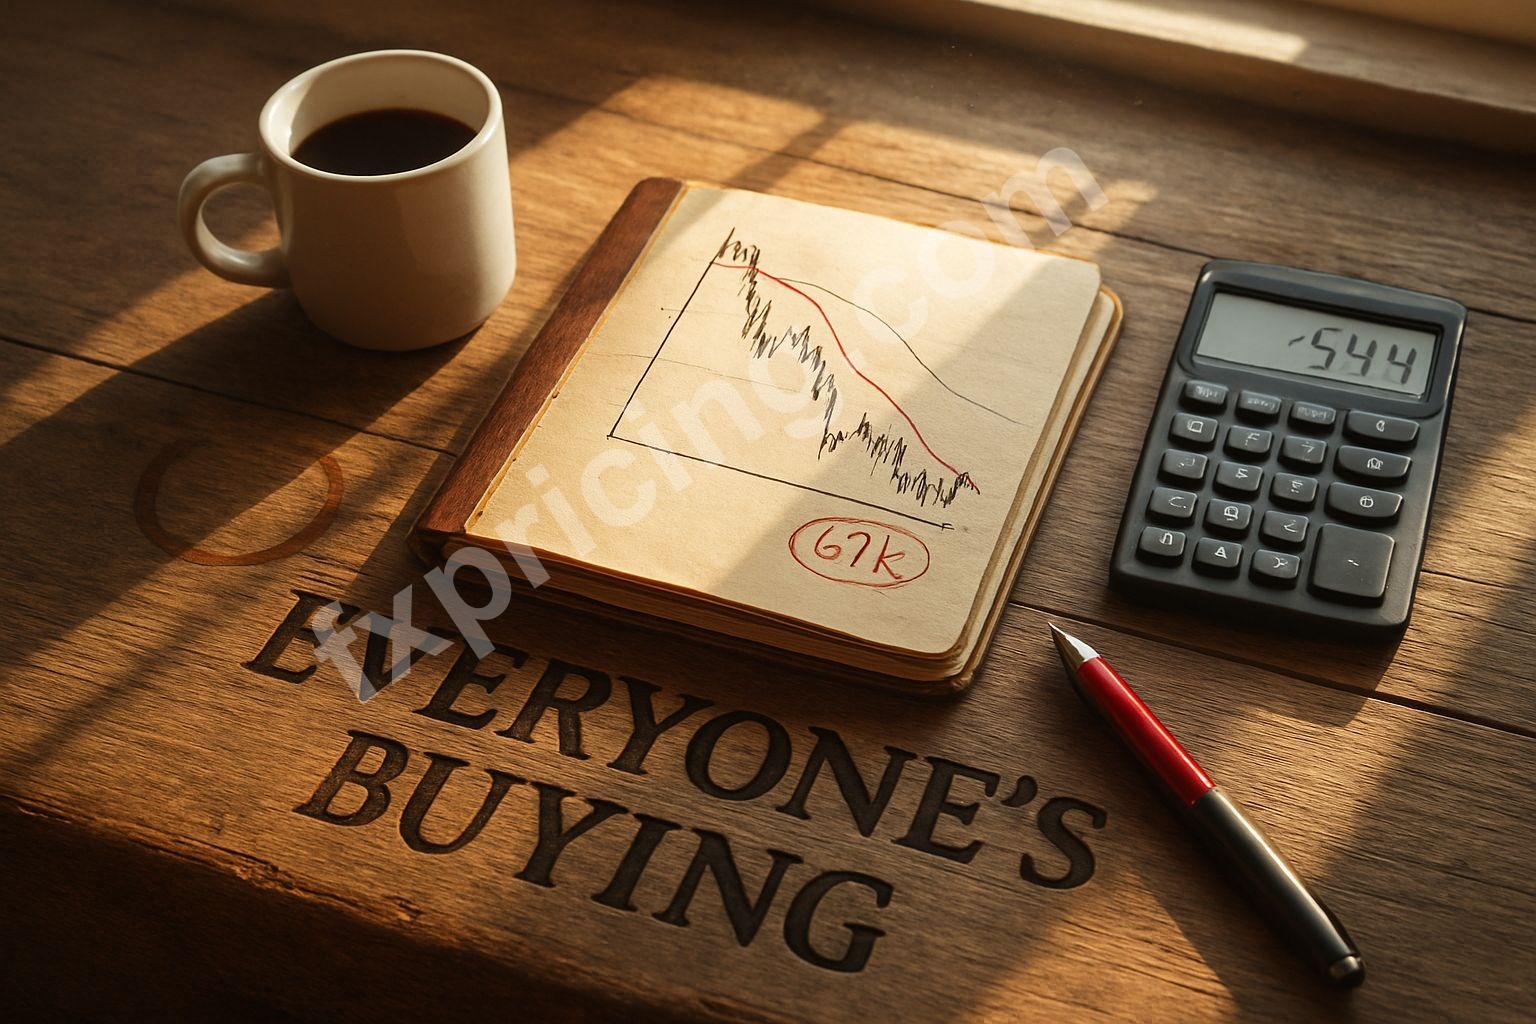
Bitcoin climbed 1.86% today to $67,201. Most people saw green and felt good. The algorithms didn't.
High-confidence sell signal. Score of -54.4. That's not a yellow flag — that's a red banner with sirens attached.
The Price Action Lie
Price action says bullish. ADX at 34.36 confirms strong trend momentum. On the surface, everything looks healthy. Open was $65,973, we're now above $67k, ATR shows volatility buyers love.
Then you check the moving averages and the whole story flips.
EMA 200 sits at $88,866. That's 32% above current price. EMA 25 at $69,020 — still above us. SMA 25 at $67,710 — we're trading below it right now despite the daily gain.
This is a bounce inside a larger downtrend. Not a reversal. A bounce.
What the Indicators Actually Say
I've seen this setup before. Price moves up, volume looks okay, everyone gets hopeful. Meanwhile every meaningful moving average is screaming sell.
| Indicator | Value | Signal |
|---|---|---|
| EMA 200 | $88,866 | Strong Sell |
| EMA 25 | $69,020 | Strong Sell |
| SMA 25 | $67,710 | Sell |
| ADX | 34.36 | Strong Buy |
The ADX strong buy tells you trend strength exists. It doesn't tell you direction relative to longer timeframes. That's where people get wrecked.
ATR at 3,254 with a percentage spread of 4.93% means volatility is high. Bitcoin-US Dollar swings are wide enough to shake out weak hands in both directions.
Pivot Points and Reality
Classic pivot support at $64,995. We tested the monthly low of $62,554 recently — that's your real floor until it isn't. Resistance at $67,558 on the classic pivot, and we're basically there right now.
Camarilla gives tighter bands. R1 at $66,196, S1 at $65,726. Narrow range. We've already broken above Camarilla resistance, which in a sell-signal environment usually means one thing: trap.
I'm not saying it crashes tomorrow. I'm saying this move up doesn't have the structure behind it. No moving average support. No break of major resistance that matters. Just a bounce traders are calling bullish because it's green today.
Why I'm Not Buying This Rally
High confidence on a -54.4 signal score means the model sees something structural. When all your EMAs are above price and trending down toward you, rallies become selling opportunities. That's it.
March 2026 and we're still 32% below the 200-day. That's not a dip. That's a different market than six months ago.
The Fxpricing Blog data doesn't editorialize. It just shows you EMA 200 at $88k and current price at $67k. You decide what to do with that gap.
I've traded enough failed bounces to know what this looks like. Price pops, bulls get loud, then it grinds sideways or drops while the moving averages keep descending. By the time EMA 200 catches down to price, you're another 15% lower wondering why you didn't sell the bounce.
The Setup I'm Watching
If we break and hold above $69,020 — the EMA 25 — maybe the picture changes. That would mean price reclaiming at least one meaningful average. Right now we're under it.
Camarilla pivot at $65,961 is your rough midpoint. Below that and the $64,995 support comes into play fast. Given ATR volatility, a move from $67,201 to $64,995 could happen in a session.
I don't chase moves that contradict every trend indicator I trust. Some people will ride this up and get out fine. More will hold too long expecting $70k when the structure says otherwise.
Check live cryptocurrency prices if you want to see how this plays out in real-time. The EMAs don't lie — they just lag enough to make you think you have more time than you do.
What I'd Do Here
Not advice, just what makes sense to me. Take profit if you're in from lower. Don't add new long positions into a high-confidence sell signal. If you want exposure, wait for a retest of support or a break above EMA 25 with confirmation.
This is a trade, not an investment thesis. The daily gain feels good but the monthly chart still shows a market trending down under all its averages.
ATR says expect big moves. ADX says the trend is strong. Moving averages say that strong trend is still bearish on any timeframe that matters. One green day doesn't override three red indicators.
I passed on this bounce. Maybe it runs to $70k and I look dumb for a week. Or maybe it rolls over at resistance and I'm glad I waited. The Fxpricing Blog tools gave me the data — the rest is just risk management.
For broader context on how crypto trading pairs move in different volatility environments, the current setup isn't unique. High ATR with declining moving averages happens. It just usually doesn't end well for late buyers.
So yeah. Sell signal. High confidence. Price going up anyway. Happens all the time. Question is whether you trade the data or the feeling.


