Today's SOUTH AFRICAN RAND / GUINEAN FRANC price is 514.433, with a signal to sell. The price action is bullish, but the signal is bearish, indicating a potential divergence.
Market Analysis
The stochastic K% is at 6.9859, which is a sell signal. The Ultimate Oscillator is at 52.9227, indicating a neutral position.
The EMA 100 is at 522.939, which is a strong sell signal. The SMA 10 is at 523.992, also a strong sell signal.
Pivot Points and Bollinger Bands
The classic pivot points are R1=516.471, S1=509.483, and P=514.141. The Bollinger Bands have a middle value of 535.79, with a position of 0.83% and a normal squeeze.
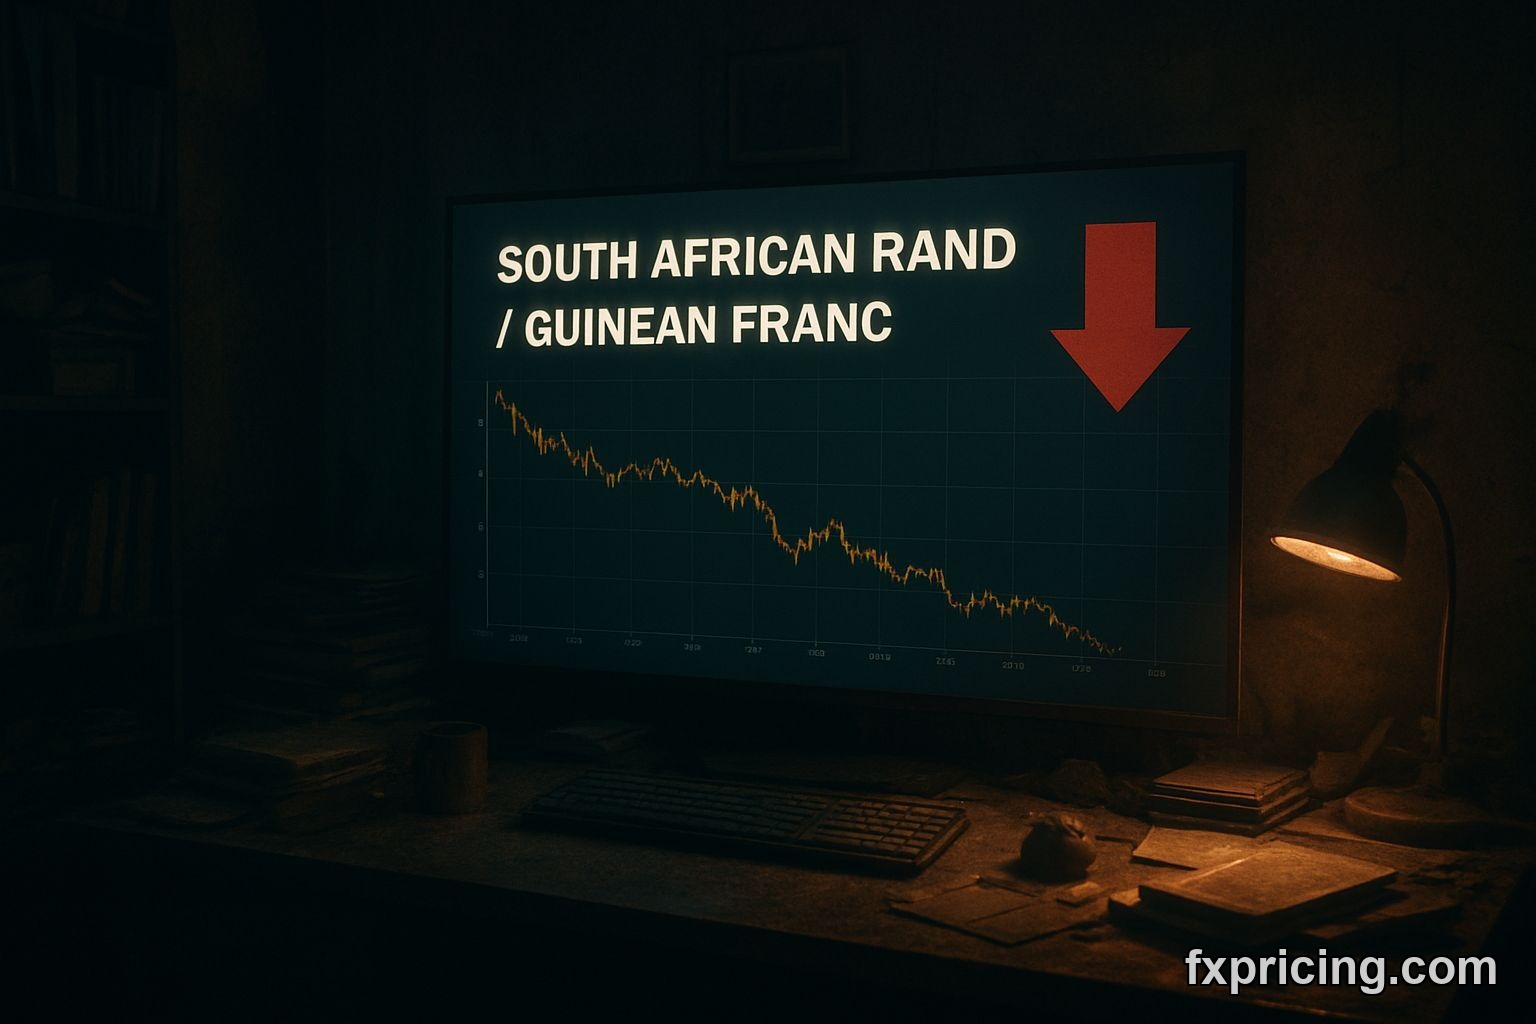
The performance of the SOUTH AFRICAN RAND / GUINEAN FRANC has been steadily increasing, with an all-time low of 414.498 and a 6M performance of 4.02021%.
Conclusion
Based on the analysis, it seems that the SOUTH AFRICAN RAND / GUINEAN FRANC price may experience a downturn. For more information on forex rates, visit forex rates or stock market prices.
I would sell the SOUTH AFRICAN RAND / GUINEAN FRANC at the current price of 514.433. The bearish signal and strong sell signals from the EMA 100 and SMA 10 support this decision.