
Down 3.57% in a session where the stock opened at 193.4 and closed at 186.5. That's not noise — that's a shooting star candle at the top of a move, and every technical indicator is screaming the same thing.
I've held hearing aid stocks before. They look stable until they're not. Sonova's signal score sits at -95.9, which is about as extreme as you'll see on any equity screen.
The Numbers Don't Lie
Strong Sell signals pile up when you look at the moving averages. EMA 25 at 197.529, SMA 10 at 194.625, EMA 10 at 193.887 — all above current price. When short-term averages cross under longer ones, momentum's gone.
The Parabolic SAR reading at 204.9 confirms it. That's a trailing stop level, and price is now 18 points below it. If you're long and didn't exit near that level, you're watching profits evaporate or losses grow.
Ultimate Oscillator at 44.64 reads neutral, which is almost worse. No oversold bounce coming soon. Just slow bleed. I've sat through plenty of those — they hurt more than quick crashes because you keep hoping for a reversal that never arrives.
Six-Month Drawdown Context
The 6-month performance stands at -20.72%. That's a fifth of your capital gone if you bought half a year ago. The all-time high? 402. Current price 186.5 means we're sitting 53% below peak.
People love to call that a "discount". I call it a falling knife until proven otherwise. The 1-month low hit 181.8, which means today's close is only 4.7 points above the recent bottom. We could easily retest that level this week.
| Indicator | Value | Signal |
|---|---|---|
| EMA 25 | 197.529 | Strong Sell |
| SMA 10 | 194.625 | Strong Sell |
| Parabolic SAR | 204.9 | Strong Sell |
None of this guarantees lower prices. But when was the last time you saw a stock with this technical setup suddenly reverse and rally 20%? It happens. Just not often enough to bet on it.
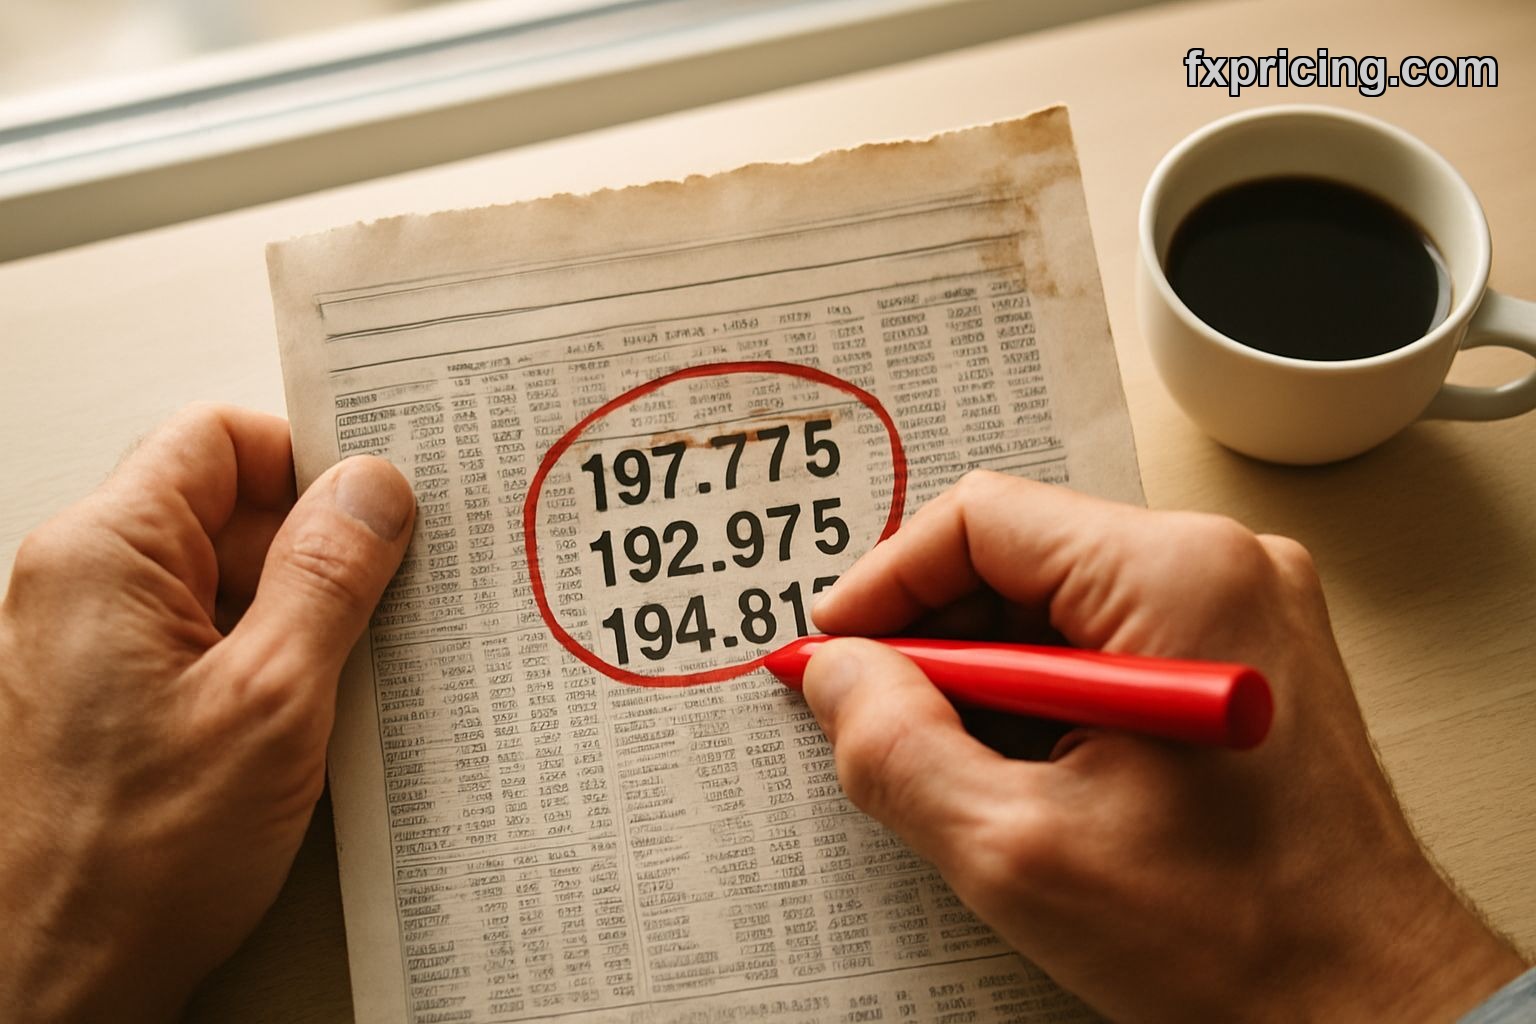
Pivot Levels and Near-Term Range
Demark pivot points give us R1 at 197.775, S1 at 192.975, pivot at 194.813. We're already below the pivot, which flips the near-term bias bearish. If we bounce, 194.8 is the first ceiling. Above that, 197.7 becomes the challenge.
On the downside, 192.9 support matters. Break that and the 181.8 low comes back into play fast. No major support between those two levels, so any selling accelerates.
I don't hold positions where the chart looks like this unless I'm explicitly shorting or selling premium. Even then, implied volatility is probably understating the move we just saw. That shooting star candle? Classic topping pattern. Doesn't mean we top here forever, but it does mean the path of least resistance tilted down today.
What This Means for Risk Management
If you own Sonova, you're already underwater or watching gains shrink. The question isn't whether this is "cheap" compared to the all-time high. It's whether the trend has any reason to reverse right now.
I see no evidence of that in the data. Moving averages declining. Price action weak despite a bullish trend label — which I think is stale, probably referring to a bounce earlier in the month that's already failed. The shooting star confirms sellers showed up at higher prices and pushed it down hard.
You could argue the stock is "due" for a bounce after losing 20% in six months. Maybe. But oversold can stay oversold. And when all your key indicators align on one side, fighting that usually costs money. I've learned that the hard way more than once.
The only neutral reading is the Ultimate Oscillator, and even that's sitting in the middle zone — no momentum either way. For those tracking live stock market prices and equity data, Sonova's setup today is textbook distribution. Big gap down, weak close, sellers in control.
Scenarios I'm Watching
Bounce scenario: We hold 181.8, chop sideways for a week, maybe claw back to 192-194 on short covering. That gives longs a chance to reduce or exit near breakeven. I wouldn't count on much more than that without a major catalyst.
Breakdown scenario: We slice through 181.8 on volume, and the next stop is probably 170-175 based on the velocity of the recent decline. No strong support visible until you hit those psychological levels or old consolidation zones from 2025.
For traders using tools like the free stock market widget to embed live data, watching these pivot levels in real-time matters. When a stock crosses below its pivot and all moving averages, the odds favor continuation lower, not reversal.
My Take on Holding Through This
I wouldn't. Not with this technical picture. If you have a long-term thesis on Sonova's business fundamentals, fine — ride it out. But don't confuse a long-term hold with ignoring what the chart is telling you right now.
The signal score of -95.9 doesn't just mean "slightly bearish". It's as one-sided as the model gets. I've seen these scores reverse, sure, but usually after more pain first. And the shooting star candle on a -3.57% day? That's not a dip to buy. It's a warning shot.
Compare this setup to something stable like Microsoft's recent action or even volatile names like


