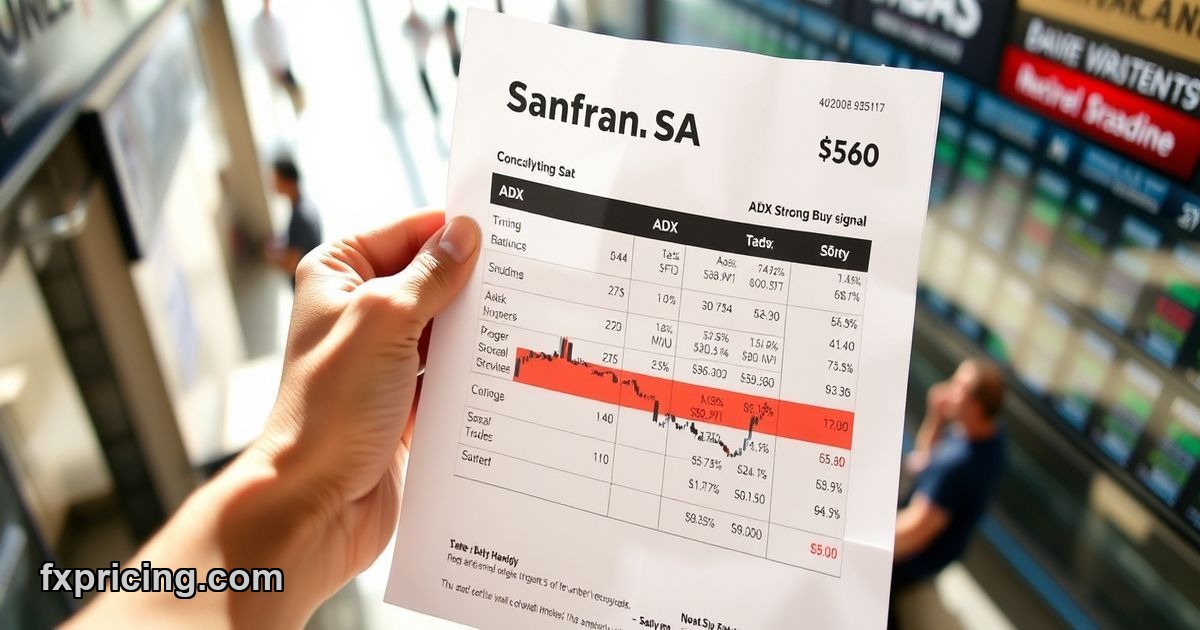
safran SA stock is getting absolutely hammered today, down a brutal -4.542% by the close. And it opened even higher at 295, then just cratered. You gotta feel that kind of hit if you were holding it. The market in Ireland clearly isn't feeling generous. But here's the kicker, the real head-scratcher: despite this bloodbath, despite the entire board screaming "Strong Sell," there’s this one indicator, the ADX, flashing a "Strong Buy." What gives?
I’ve seen this before, felt the burn. You see a green light in a sea of red, and you think, "Ah, finally a bounce!" But sometimes it's just a dead cat. Or a trap. And with Safran SA, it looks like a textbook trap right now. Anyone looking at this stock for a live stock market price better be damn careful.
Safran SA Price Today: The Hard Numbers and Why They Matter
Let's just look at the raw data for Safran SA price today. The price hit 281.6. Opened much higher, at 295, remember? That's a massive gap down intraday. And it’s not just today. The 1W Performance for Safran SA is an ugly -8.24373%. This isn’t just a bad day, it's a terrible week.
The overall signal is "Strong Sell," and the Signal Score is a grim -91.2. Not exactly screaming confidence, is it? Confidence in this "Strong Sell" signal is high, so it’s not some wishy-washy call either. You got to respect that. Most of the technicals agree with this, too.
But the real wrench in the gears? The Price Action is listed as "Bullish." And the Candle Pattern is "Normal." See, that’s where it gets confusing. How can you have bullish price action and a normal candle when the stock is getting absolutely annihilated? This divergence is what makes a market dangerous, it makes people doubt their gut.
Safran SA Analysis: The Oscillators Tell a Story
Let's dive into those oscillators because that's where things get interesting, and frankly, contradictory. The Parabolic SAR is at 313.557 and also giving a "Strong Sell" signal. It's consistently above the current price, confirming the downward trend is in full force. So far, so bad.
But then you hit the ADX, the Average Directional Index, and it’s sitting at 30.3489 and screaming "Strong Buy." A strong buy, after a -4.542% day, after a -8.24373% week. This is the anomaly, the thing that sticks out like a sore thumb in all this red. People are gonna see that and think, 'oh, maybe it's oversold!' And that's exactly what you shouldn't be thinking right now.
When you have almost every other metric flashing red, an isolated "Strong Buy" can be deceptive. It might indicate strong buying pressure within a larger downtrend, a temporary rebound, a bounce off a minor support before it continues its slide. I've bought into that kind of hope before, just to watch my capital vanish. Look at the broader picture, always. This isn't the kind of free live forex rates environment where you ignore red flags, know what I mean?
Moving Averages and Their Bearish Grip
The moving averages are equally unforgiving for Safran SA. All of them are firmly in "Strong Sell" territory, no surprise there given today’s performance. They're all way above the current price of 281.6:
- SMA 100: 308.98 (Strong Sell)
- SMA 25: 324.38 (Strong Sell)
- EMA 25: 313.799 (Strong Sell)
This is what you expect when a stock is in a serious downtrend. The price is trading well below its key moving averages, showing sustained selling pressure and a clear bearish momentum. No bullish crossovers anywhere, no signs of life here. It just reinforces the overall picture. These things are lagging indicators, sure, but when they're all aligned like this, they’re telling you something real. And it's not good.
Safran SA Support Resistance: Key Levels to Watch
The pivot points offer some crucial levels for Safran SA support resistance. Given the current price action, these are gonna be tested fast. Especially the support levels. The Camarilla pivot points are set up like this:
- R1: 294.108
- S1: 292.292
- P: 293.2
These are all well above the current price of 281.6. The price blew right through them on its way down today. Which means, looking ahead, R1 and P will act as significant resistance if there's any attempt at a bounce. S1 is barely even a blip anymore. We need to find new support zones. The previous pivot points? They're now major hurdles, not safety nets.
And you know, when a stock drops like this, it makes you re-evaluate everything. I remember thinking one time that a pivot point would hold for Microsoft Corporation, bought it around there, then watched it slide another 5%. Sometimes the market just laughs at your analysis. This isn't a textbook, this is real money on the line.
So where does Safran SA find its footing? That's the million-dollar question for anyone looking at this market right now. The ADX might scream "Strong Buy," but with these pivot points getting blown past, there's no immediate floor in sight. The old-time traders would tell you, never try to catch a falling knife.
Safran SA Forecast 2026: Bollinger Bands and Volatility
Let's talk about the Bollinger Bands and what they tell us about the Safran SA forecast for 2026. The Middle Bollinger Band is at 324.38, way above the current price. Its Position is at 12.83%, which is low, meaning the price is trading near the lower band. And that makes sense, right? It's been hammered. The Squeeze is "Normal" though, which means we might not be seeing a massive explosive move immediately after this drop, but who knows?
Volatility is "High," with an ATR% of 3.4917. This confirms what we're seeing in the price action. Safran SA is moving, and it's moving fast. High volatility means bigger swings, which can be great if you’re on the right side of the trade. If you're on the wrong side? It’s a fast track to regret. Combine high volatility with a "Strong Sell" overall signal, and you've got a recipe for quick losses if you try to fight the trend.
I’ve chased high volatility stocks before, thinking I could just scalp a quick profit. One time with Bitcoin, I got in right after a big drop, thinking it was bottoming. Nope. Dropped another 10% in an hour. Volatility is a double-edged sword, and it cuts both ways. You gotta be careful when you see that, especially when the overall signals are this overwhelmingly bearish.
Safran SA Buy or Sell: Performance and Outlook
So, is Safran SA a buy or sell? Well, the overall signal says "Strong Sell," and the performance backs that up. It's been down -8.24373% in a week. Today alone saw a major drop. The All-Time Low for Safran SA is 4.85, showing just how far this stock has come. But past performance, even from the ATL, doesn't mean it can't fall further from here. It certainly implies there’s been significant growth, but also that this recent pullback is a serious concern.
My take? The ADX "Strong Buy" is a trap. It's an indicator of trend strength, yes, but when it’s paired with a dominant "Strong Sell" signal, falling price, and every major moving average above the current price, it's screaming that the strength of the downtrend is high. Not that it's a good time to buy. This is critical. Sometimes these indicators, they tell you a story, but you gotta read between the lines, see the full picture. Don't just cherry-pick the one green signal.
The general Safran SA outlook for 2026 remains cloudy from this perspective. We're in a strong downtrend. It needs a massive reversal to even think about turning things around. And that's not happening when the stock is shedding -4.542% in a single day and the technicals are this aligned against it. The market isn't waiting around.
And you see this happen all the time. Investors clinging to that one positive sign, ignoring everything else. It's a classic mistake. I did it with Intel Corporation once. Saw some indicator flash positive, bought in, then it just kept going down. Lost a decent chunk. The market doesn't care about your hope.
Safran SA Target Price: What Does This Mean?
With Safran SA at 281.6 and so many "Strong Sell" signals, a "target price" is tough to pin down in terms of upward movement. The resistance levels from the Camarilla pivots are all above current price, so 294.108 and 293.2 become targets to overcome not targets to reach easily. They're barriers, massive ones. The real target right now is likely lower, trying to find where this freefall might eventually pause.
The High confidence in the "Strong Sell" signal suggests this downward pressure is expected to continue. People always want to know the bottom, but the truth is, nobody really knows. All we can do is look at the data and make an informed guess. And right now, the data is not suggesting a bottom for Safran SA. It's suggesting more pain to come. The ATR% of 3.4917 means it could easily drop another few points tomorrow.
So if you're asking about the Safran SA target price, in the short term, it's more about identifying the next support level it will breach than anticipating a rally. Unless there's a significant shift in the market or some fundamental news that changes the game, this stock looks like it's got more room to fall. Will that ADX "Strong Buy" be proven right eventually, indicating a strong trend reversal, or is it just noise in a bearish storm?