

Gold opened at $5,080 and closed the session at $5,043. That's 36 bucks gone. Not a crash, but enough to make you check twice.
The technical signal? Weak Buy. Signal score sits at 21.6, which is barely above neutral. The trend itself? Weak. Price action claims bullish but the indicators aren't screaming confidence.
What the Signal Actually Means
A Weak Buy isn't a buy. It's a maybe. It's the market saying "I'm not sure yet" while still leaning slightly positive. That 21.6 signal score is low. I've seen stronger conviction from a coin flip.
The change today was -0.716%. Small in percentage terms but when you're trading at $5,000+ per ounce, those fractions add up fast. You lose $36 on one contract and suddenly you're questioning the whole setup.
ATR came in at 153.972 with a Buy signal. That's volatility, which gold has in spades right now. ADX at 13.2256 also says Buy, but ADX measures trend strength and 13 is pathetic. Anything under 25 usually means the market's just drifting.
Moving Averages Tell a Different Story
Here's where it gets interesting. SMA 200 sits at $4,030. EMA 100 is at $4,612. Both scream Strong Buy because price is miles above them. Gold's up over $1,000 from the 200-day average.
That sounds great until you realize it also means gold's been on a tear and might be due for a breather. Or a correction. Or a full reversal if sentiment shifts.
The Ultimate Oscillator came back Neutral at 47.1546, which is basically the market shrugging. Not overbought, not oversold, just… there. I don't trust Neutral readings when the trend is this weak. It usually means consolidation before the next big move, but which direction?
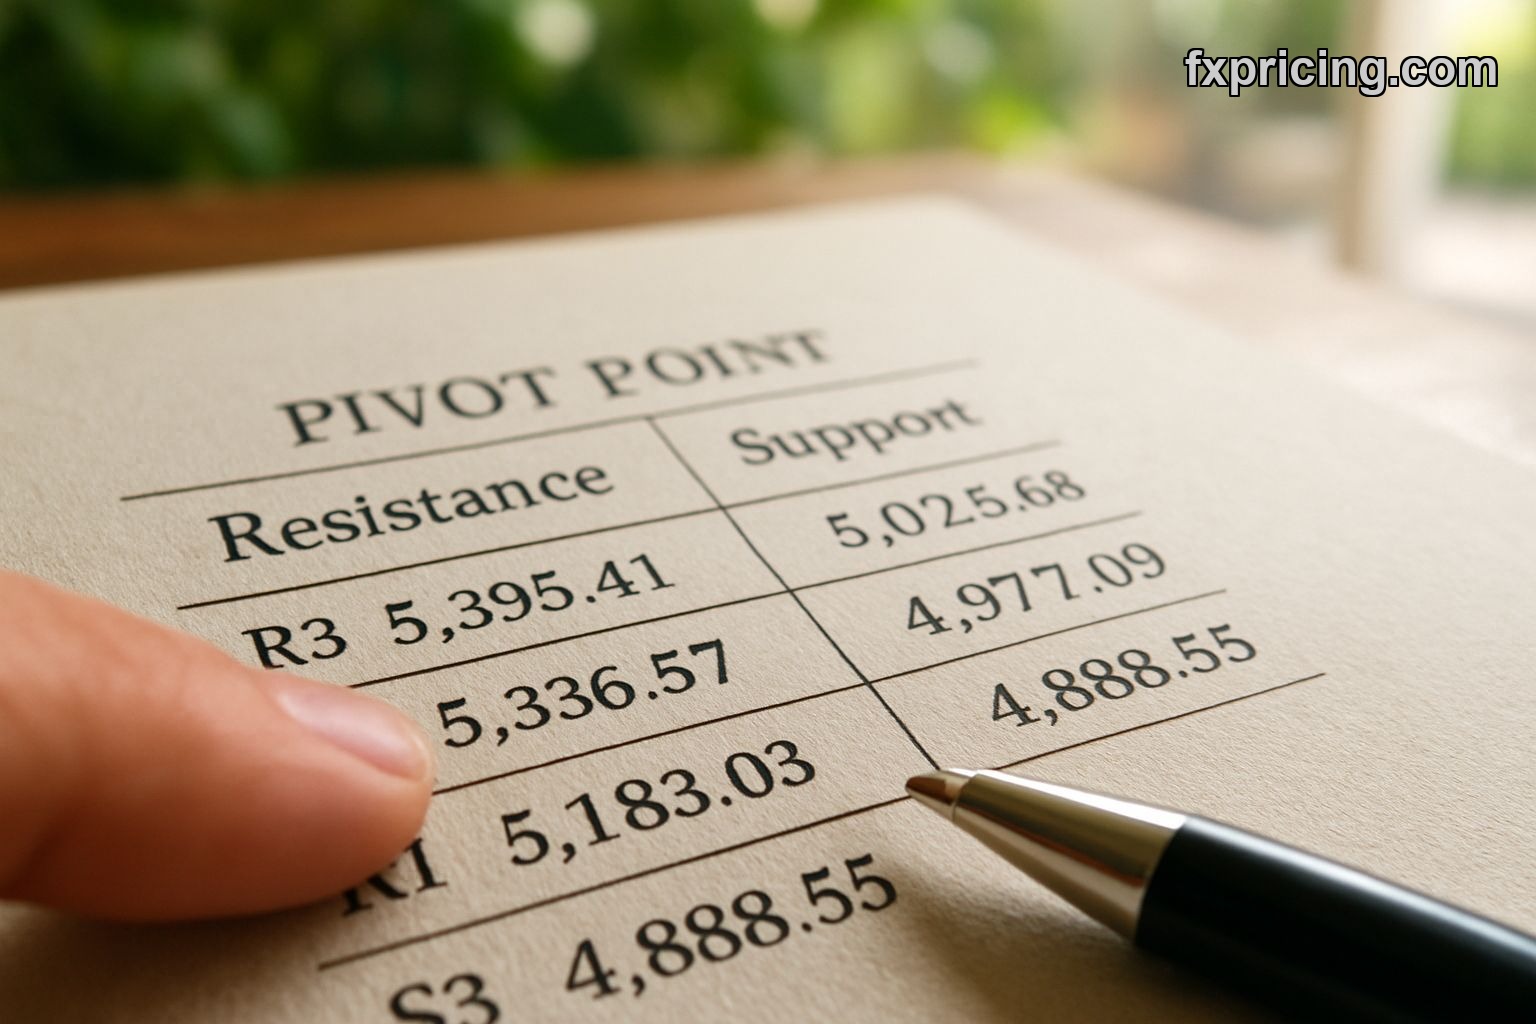
Pivot Points and What They Mean for Next Week
Classic pivot point shows R1 at $5,162 and S1 at $5,025. The pivot itself is $5,108. Price closed at $5,043, which is below the pivot and closer to support than resistance. That's not bullish.
If gold breaks below $5,025, we're looking at the next support level down. If it bounces and clears $5,108, then maybe — maybe — that Weak Buy signal starts to matter. But right now we're sitting in no-man's-land.
The 1-month high was $5,419. That's $375 above current price. We've given back a chunk of that rally and the momentum isn't there to reclaim it fast. When I see price action like this, I wait. I don't chase.
Why This Setup Makes Me Nervous
Gold at $5,000+ is expensive. Not just nominally but relative to recent history. The all-time low was $20.54, which is basically trivia at this point, but the 200-day SMA at $4,030 is real. That's the long-term average and we're 25% above it.
Weak trend. Weak signal. Price below the pivot. ADX under 15. These are not the ingredients for a confident long position. If you're holding gold from lower levels, fine. If you're thinking about entering here, I'd want a better setup.
| Indicator | Value | Signal |
|---|---|---|
| ATR | 153.972 | Buy |
| ADX | 13.2256 | Buy |
| Ultimate Oscillator | 47.1546 | Neutral |
| SMA 200 | 4030.02 | Strong Buy |
| EMA 100 | 4612.28 | Strong Buy |
The moving averages say buy because we're above them. But being far above doesn't mean we keep going up. It often means the opposite. Reversion to the mean is real, and gold's been running hot for months.
What I'm Watching Now
First, can price hold above $5,025? That's the S1 pivot support. Break below that and we're probably headed toward $5,000 psychological, then $4,900 if that fails. On the upside, $5,108 is the level to reclaim. Clear that and maybe we test $5,162.
Second, I want to see ADX climb above 20. Right now it's saying there's no real trend, just noise. A Weak Buy signal in a trendless market is useless. I need confirmation.
Third, volume and volatility. ATR is high, which is good for day traders but rough for swing positions. If you're holding overnight, that 153-point ATR means you could wake up $100 off your entry either way.
Check the forex rates if you're trading gold against other currencies. Sometimes the dollar move is bigger than the gold move. Also worth comparing to Bitcoin because both act as inflation hedges, sort of.
My Take for March
Gold's in a holding pattern. The Weak Buy signal isn't enough to act on, not with a Weak trend and price sitting below the pivot. If you're long from $4,800 or lower, you're fine. Trail your stop and don't get greedy.
If you're looking to enter, wait. Wait for a break above $5,108 with conviction, or wait for a dip toward $5,000 and see if it holds. Don't buy the middle of the range hoping it resolves your way. That's how you get chopped up.
The big picture? Gold's still well above its long-term averages. The 200-day SMA at $4,030 is a long way down. The EMA 100 at $4,612 is closer but still $400 below current price. These are expensive levels. You're not buying a dip, you're buying near recent highs after a pullback. Know the difference.
For more price data and live updates, the Fxpricing Blog covers equities and metals. I'm watching this one daily because the setup could break either way fast.
Are you holding gold above $5,000 or waiting for a better entry?


