
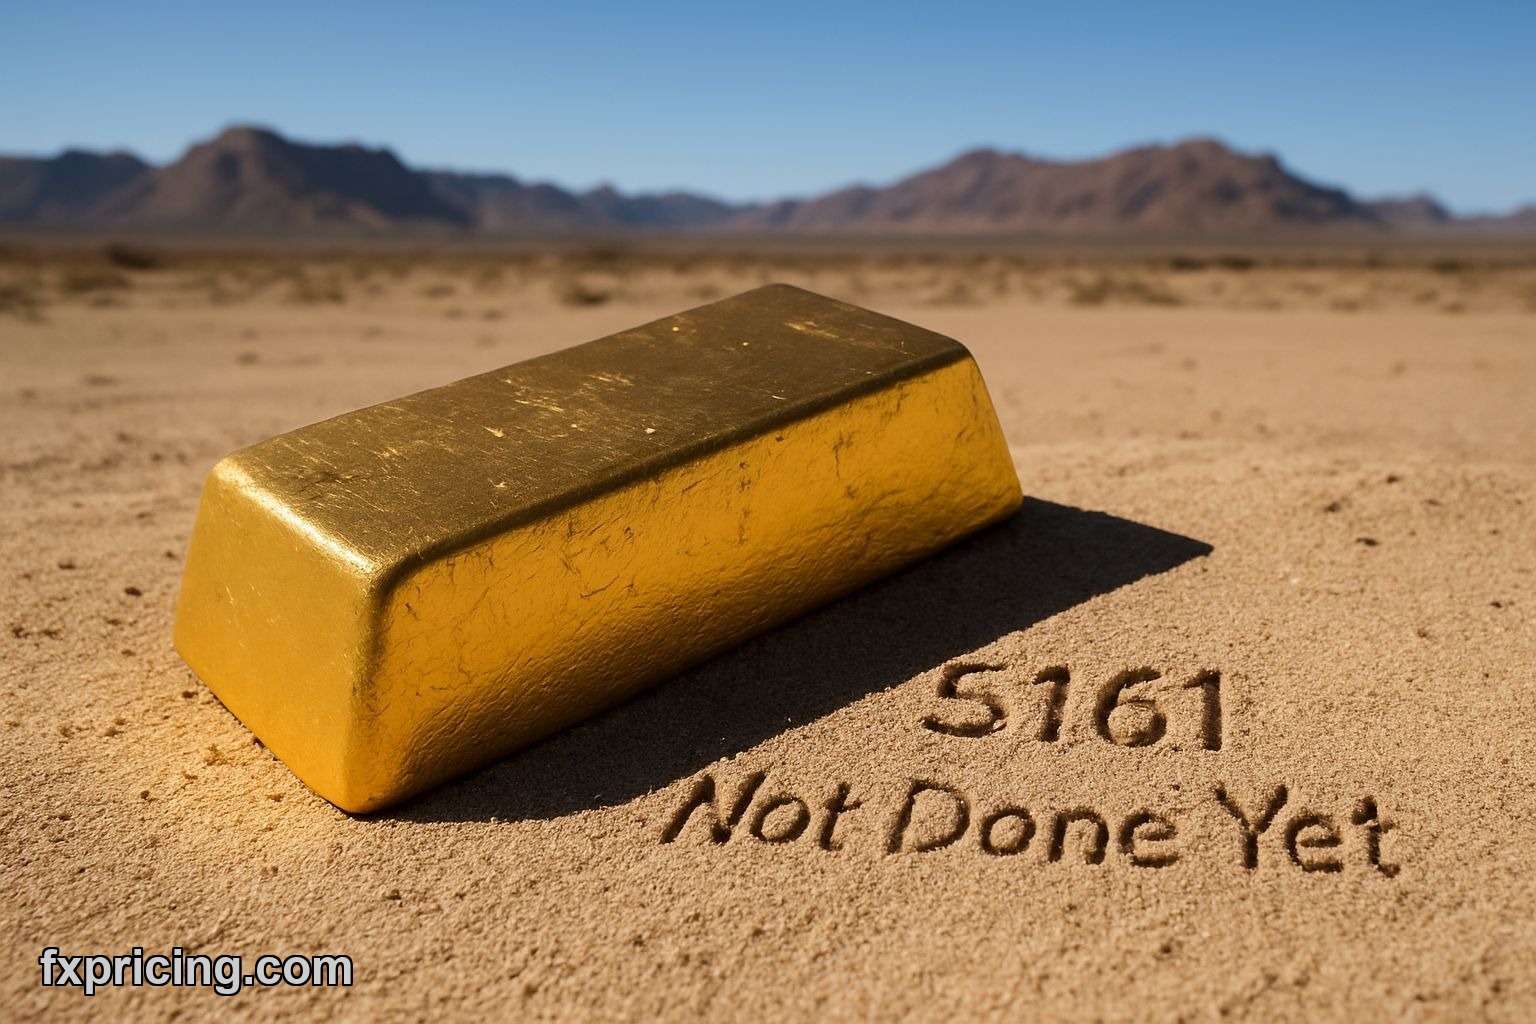
Gold just punched through $5160 and nobody seems worried about catching a top. I'm not either. The metal opened at $5086, gained 1.47% by close, and every oscillator on my screen is green.
The Parabolic SAR sits at $4908. That's not a typo — the momentum floor is more than 250 points below current price. When that gap is this wide on a Strong Buy signal, you're either in a bubble or you're early in a bigger move. I think it's the second one.
The 200 EMA Says This Started Months Ago
The 200-day exponential moving average is at $4119. Gold is trading a thousand dollars above that line. This isn't a two-week bounce — this is a structural shift that began before most retail traders noticed.
I pulled data going back to the all-time low at $20.54. Yeah, gold was twenty bucks once. The all-time high hit $5598 recently, which means today's price is only 7.8% off the peak. That proximity matters.
When you're within 8% of all-time highs and still getting Strong Buy signals, the market is telling you something. Either sentiment hasn't caught up to price, or there's a fundamental bid that won't quit. My guess? Central banks and macro fear. But I'm writing on Fxpricing Blog, not running a think tank, so let's stick to what the chart says.
Short-Term Averages Are Almost Useless Here
The 10-day simple moving average is at $5178. Gold is trading below it by about $17, which is why that indicator shows Neutral. But here's the thing — short-term averages in a strong trend are speed bumps, not stop signs.
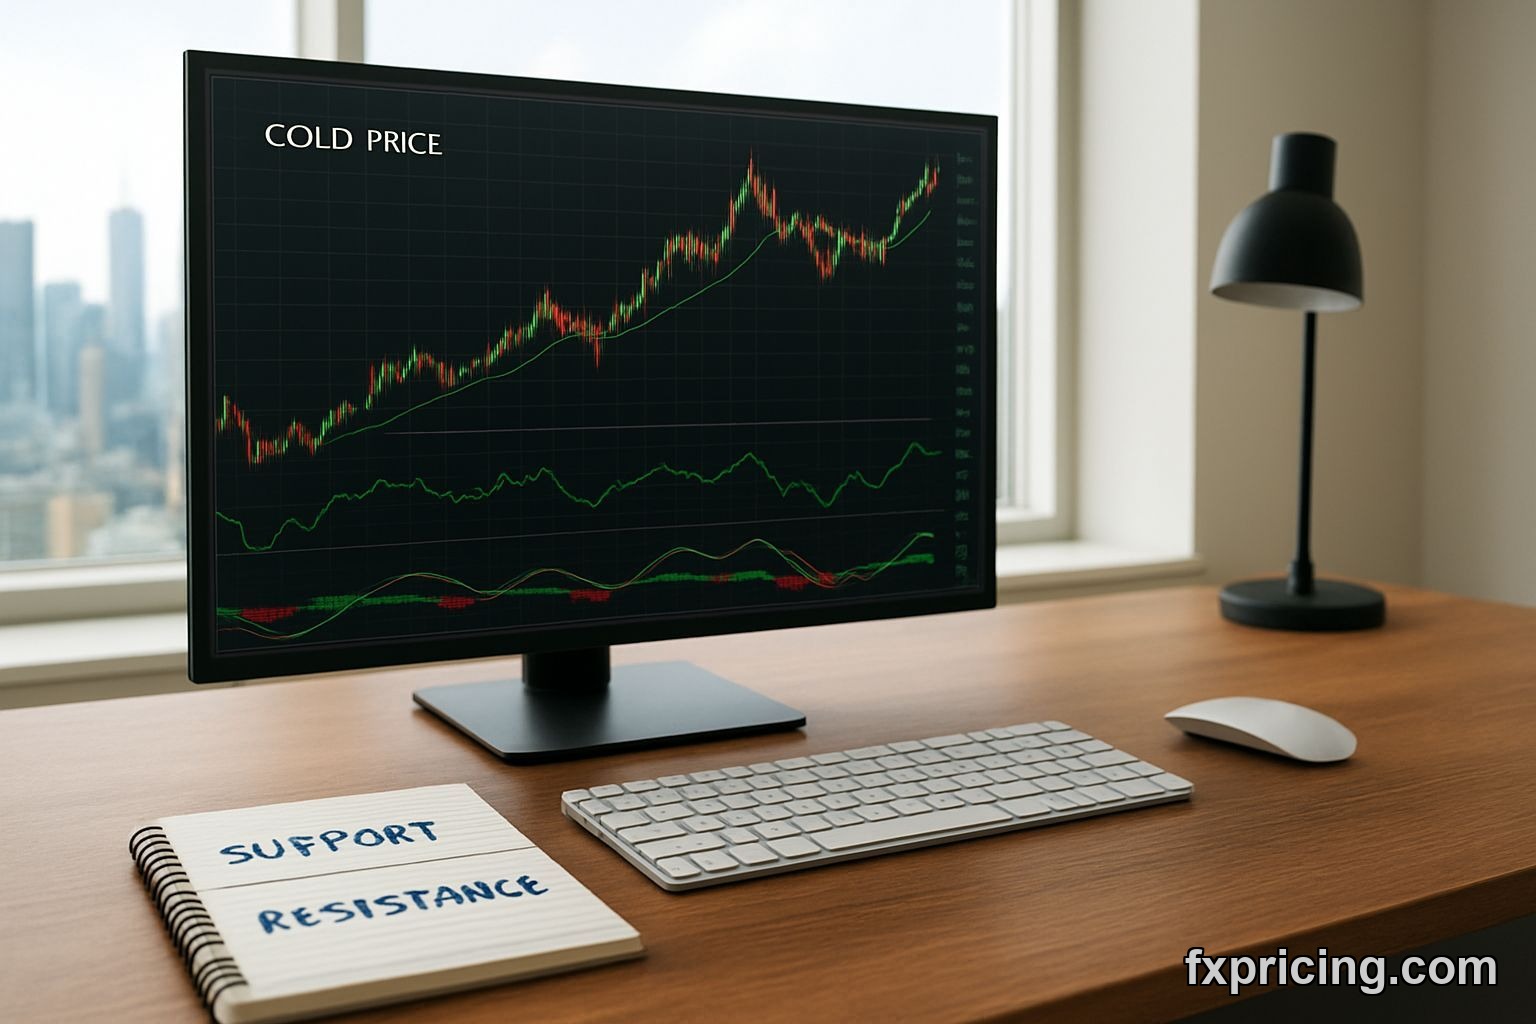
The one-month high was $5419. That's 258 points above today's close. If gold reclaims that level, the next leg is wide open. The pivot points give us a classic resistance at $5168 and support at $5024, with the pivot itself at $5109. Tight range for a metal that's been ripping for weeks.
I don't love tight ranges during strong trends. They either snap higher or they trap late longs. But with an ADX reading of 16.53 tagged as Strong Buy, the directional momentum is still intact even if it's not explosive right now.
What About the Downside?
Support is at $5024 on classic pivot math. Below that, you've got the Parabolic SAR at $4908. If both of those break, the trade is probably over for now and you bail. I don't see it happening this week unless something breaks in currency markets or we get a surprise rate hike somewhere.
Gold doesn't move in a vacuum. It's sensitive to dollar strength, real yields, and geopolitical noise. Right now all three are working in its favor. The forex rates show the dollar under pressure against most majors, which gives gold more oxygen.
I've been tracking this on the forex widget I keep open all day. Every time the dollar dips, gold pops. It's been clockwork for two months.
The All-Time High Is Still in Play
$5598 is the number. That's 437 points from here, or about 8.5% upside. For a commodity that just gained 1.47% in a single session, that's two good weeks if momentum holds.
I'm not calling for $6000 gold by summer. But I am saying that the path of least resistance is still up. The moving averages, oscillators, and price action all point the same direction. When everything agrees, you don't fight it.
Some traders are watching Bitcoin instead, thinking it's the new safe haven. Maybe. But gold doesn't have exchange risk, custody risk, or regulatory risk. It's boring, it's old, and it's working.
What I'm Doing
I added to my position yesterday at $5120. Took heat when it dipped to $5086 this morning, then felt smart by lunch. That's how these things go. My stop is below $5000 because I'm not married to the trade.
If gold breaks $5200 cleanly and holds it for two sessions, I'll probably add again. If it stalls here and starts chopping between $5100 and $5180, I'll trim and wait for a clearer setup. The worst thing you can do in a trending market is get cute with range-bound strategies.
The one-month high at $5419 is my next target. If we get there, I'll reassess. Until then, the trend is my friend, the oscillators are green, and I'm not seeing any reason to fade this move.
Risks I'm Watching
Dollar strength is the obvious one. If the Fed signals more hikes or if Treasury yields spike, gold will get hit. The other risk is a liquidity event — something that forces selling across all assets, safe havens included.
Geopolitical flare-ups usually help gold, but not always. If a crisis leads to dollar hoarding, gold can drop even as fear rises. Saw it happen in early 2020. Not fun.
Technical risks are easier to manage. Break below $5024 and I'm out. No drama, no hoping it comes back. The chart gives you levels for a reason.
Final Take
Gold is expensive, overbought by some measures, and still a Strong Buy by most others. The 200 EMA is a thousand dollars lower. The Parabolic SAR is 250 points below. The all-time high is 437 points above. That's a lot of space on both sides, but the momentum favors the upside.
I'm holding, watching the $5200 level, and keeping my stop tight. This could be the start of a run toward $5600, or it could be the top tick before a 10% correction. Either way, the odds right now favor the bulls.
Are you long gold at these levels, or waiting for a pullback that might never come?


