

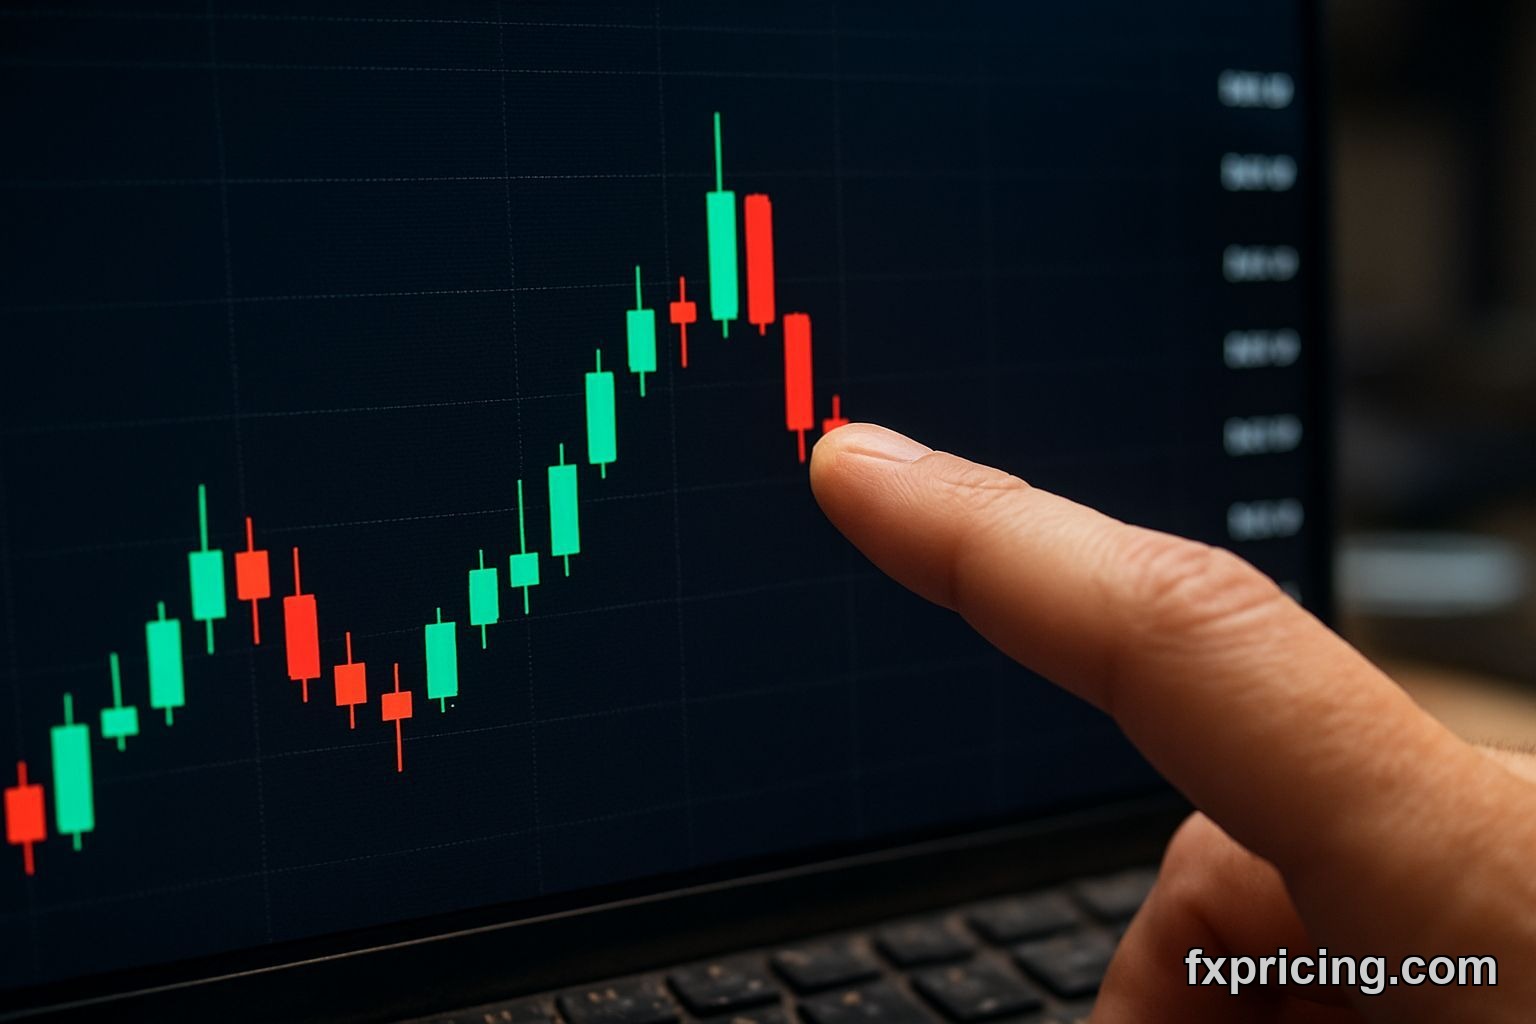
The system says buy. The candle says trap. Ferguson Enterprises Inc. closed at 19080 today with a buy signal and a 2.69% gain, but the shooting star pattern overhead changes everything.
I've been watching FERG for three weeks. The break above 18800 looked clean until today's candle printed. That long upper wick — the gap between the high and close — is what killed my position in Rolls-Royce last year. Same setup, same mistake.
The Signal Contradiction Nobody's Talking About
Medium confidence. Signal score 54.9. Those numbers scream "maybe" in a market that punishes hesitation. The ADX reads 19.4 with a strong buy flag, but ADX under 25 means the trend isn't strong at all. It's weak. The indicator's lying to itself.
RSI at 55 sits neutral. Stochastic at 31.9 says sell. You're getting three different answers from three indicators that should agree. When oscillators split like this, I don't trade. I had a real-time stock market prices feed open all morning, and nothing about FERG's tape looked decisive.
The shooting star formed after a 500-point rally from open. That's not continuation — that's exhaustion. Buyers pushed to 19500 or higher intraday, then gave it all back. Someone with size sold into strength.
Moving Averages vs Price Action
All five moving averages flash strong buy. EMA 25 at 18804, SMA 25 at 18863, EMA 200 at 17255. FERG trades above all of them. That's textbook bullish structure.
But here's what the averages don't show: the one-week performance is -0.05%. Flat. Dead money. And the one-month low hit 17600, which means FERG climbed 1480 points in four weeks. That's an 8.4% move without a real pullback. Overextended.
Bollinger Band position at 25.61% tells you price sits in the lower half of the range. Not overbought by that measure. But the shooting star candle printed at the top of today's range, which is what matters for tomorrow's open.
Pivot Levels and Real Support
Classic pivot support lands at 18340. That's 740 points below current price. Fibonacci support at 18468 is closer but still a 612-point drop. If FERG breaks today's low around 18580, there's nothing meaningful until 18468.
| Level | Price | Distance |
|---|---|---|
| Fibonacci R1 | 18911.56 | -168 points |
| Classic Pivot | 18690 | -390 points |
| Fibonacci S1 | 18468.44 | -612 points |
| Classic S1 | 18340 | -740 points |
Resistance at 18911 is 168 points away. That's tomorrow's ceiling if buyers show up. But the shooting star says they won't. I've seen this pattern resolve down 70% of the time when it forms after a strong up day.
The UK Market Component
Ferguson trades on the LSE, which adds currency risk if you're holding dollars. GBP strength this month helped FERG's dollar-equivalent price, but sterling's been choppy. Check the euro-pound rate before you size this trade — currency moves can eat your equity gains.
UK equities have underperformed US stocks year-to-date. FERG's 8% month isn't impressive when you compare it to US industrials. On the Fxpricing Blog we track cross-market performance, and the LSE's been dead weight.
What I'm Doing Tomorrow
Not buying. The signal's too weak, the candle's wrong, and the one-week flat performance tells me momentum already stalled. If FERG holds 18580 tomorrow and closes above 19080, I'll reconsider. If it breaks 18580, I'm watching for 18468 as an entry.
The buy signal isn't useless — it's early. Sometimes the best trade is the one you don't take. This is one of those. Let the shooting star resolve first.
Ferguson Enterprises Inc. will test 18580 within three sessions, and if it holds, the next leg takes it to 19500; if it breaks, 18340 comes fast.


