
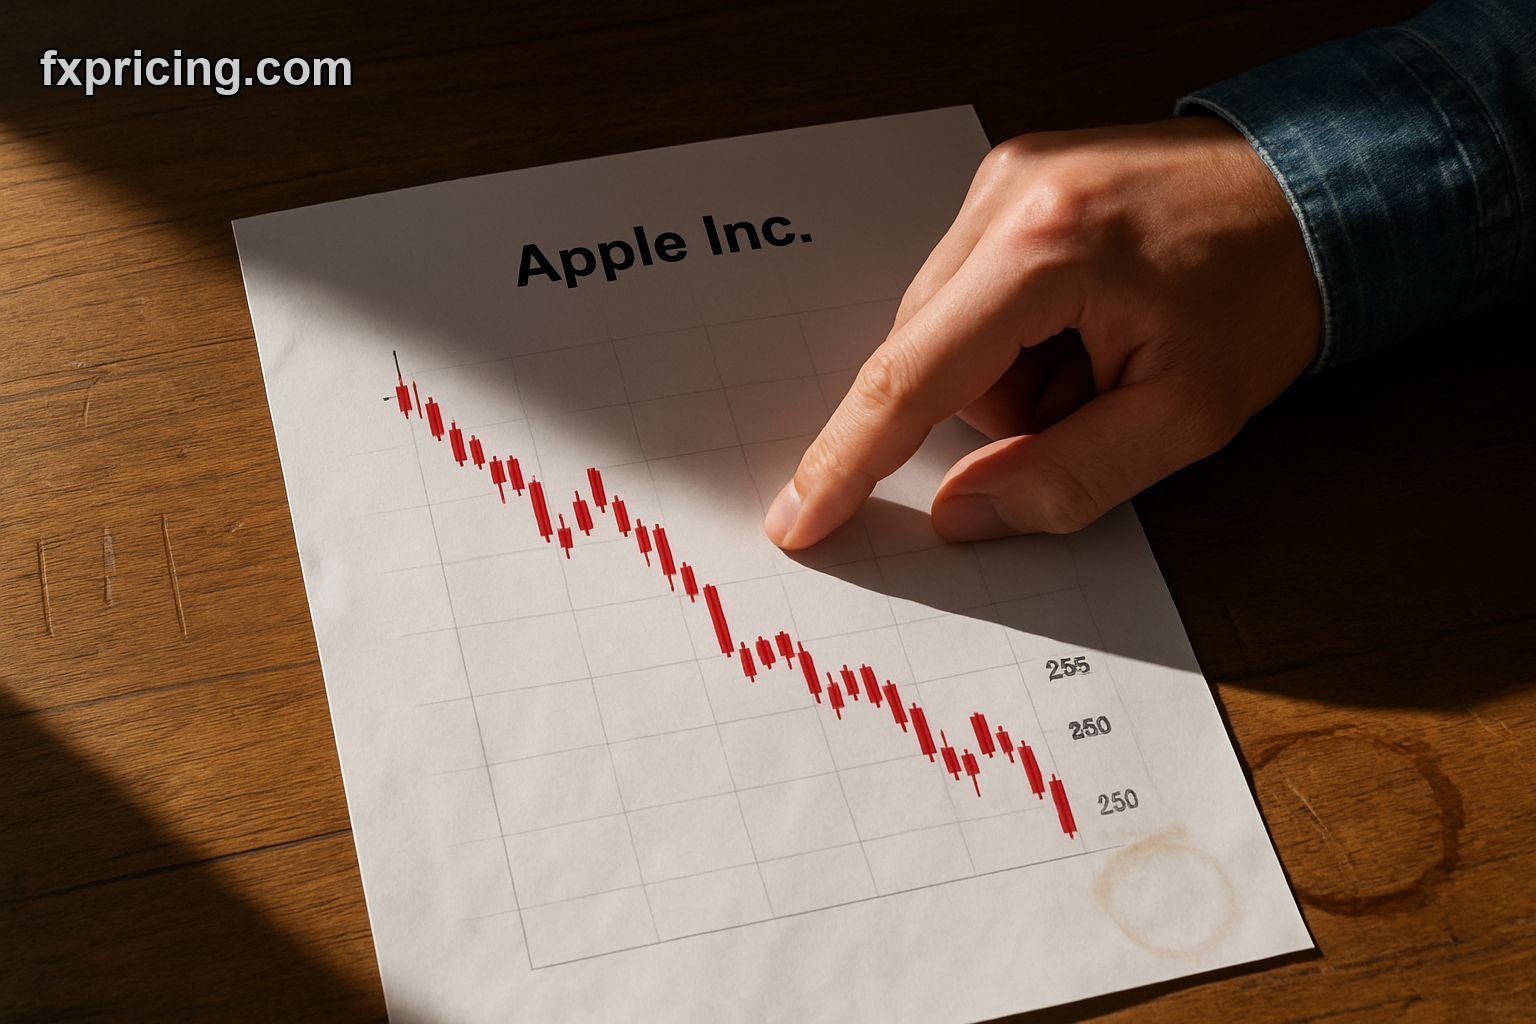
$255.76. That's where Apple closed today, down from a $258.66 open. The signal? Sell. Signal score -39.3. Not close, not borderline — a clear directional call.
I've been watching this one because the indicators are fighting each other. And when that happens, someone's about to be wrong.
The Moving Averages Don't Like This Price
Both the 10-day SMA and 100-day EMA are screaming Strong Sell. The SMA sits at 261.02, the EMA at 261.26. Price is below both, and not by a little.
That's the kind of setup where the trend folks get excited. Price below major averages, momentum turning south, you sell the rip. I get it.
But here's the thing — the RSI is at 39.7. That's a Buy signal. Not neutral, not wait-and-see. Buy. So you've got trend indicators saying sell and momentum saying buy. One of them is lying or early or both.
What the Candle Pattern Actually Tells You
Today printed a Hammer. That's supposed to be bullish. You get a hammer after a selloff, it signals buyers stepped in at the lows, and maybe the bleeding stops.
Except the overall price action is still labeled bullish, which makes no sense when you're down over 1% and sitting below both moving averages. This is the kind of mixed message that keeps you up at night if you're holding a position.
Bollinger Band position is 37.35%, meaning price is closer to the lower band than the upper. Middle band at $265.78. That's nearly $10 above current price. Squeeze is normal, so no breakout setup brewing yet.
Volatility Is High
ATR percentage at 2.33%. That's not sleepy. That's enough daily range to either save you or wreck you depending which side you're on.
If you're looking at support levels, Woodie pivot gives you S1 at $259.52. We're already below that. R1 is $262.10 — you'd need a full reversal just to test it.
Six-month performance is still positive at 11.58%. One-month low was $253.68, so we're only about $2 above that. Not a lot of cushion if this keeps sliding. Need real-time data to track these levels minute-by-minute? Check the live stock market prices to see where we actually are right now.
The Ultimate Oscillator Isn't Helping
Neutral at 52.27. No edge there. When you need a tiebreaker and the oscillator shrugs, you're on your own.
So here's where I land. The sell signal is based on trend. The buy signal from RSI is based on price being stretched. Both can be right — just on different timeframes. If you're a swing trader, you probably respect the moving averages and sit this out or short it. If you're looking for a bounce trade, that RSI under 40 and the hammer candle might be your entry.
I'm not doing either right now. The six-month chart says this stock has been a winner, but the last month says it's losing steam. When trend and momentum split like this, I wait. I've been burned too many times jumping in early on a "buy the dip" setup that turned into a "catch the falling knife" disaster.
What Happens If We Break the One-Month Low
That's $253.68. We're two bucks away. If that level doesn't hold, the next support is anyone's guess. You can look at historical pivots, Fibonacci levels, all that — but in real time, support is just where buyers show up. And right now, I don't see evidence they're ready to.
Apple Inc. forecast for 2026 depends a lot on whether this is a pause in an uptrend or the start of something worse. The Microsoft price action has been steadier, for what it's worth. Big tech isn't moving as a bloc right now.
The Fxpricing Blog take: this is a wait signal, not a buy or sell. Yeah, the official signal says sell, and maybe that's the right call if you're already long and want to cut risk. But I'm not shorting a stock that's up 11% over six months just because it had a bad week. And I'm not buying a stock that's below both key moving averages just because RSI is low.
The Trade I'm Not Taking
If I were forced to pick, I'd sell. The trend is clearer than the oversold bounce setup. But forced trades are bad trades, so I'm sitting this one out until price either breaks the low or reclaims that $261 level where the averages sit.
That's the line. Above it, maybe the bulls are back. Below $253, the bears are in control. In between? Just noise. And I don't trade noise anymore, not after last year when I got chopped up trying to catch every move.
Apple Inc. buy or sell decision comes down to your timeframe. If you're holding long-term and believe in the company, this dip doesn't matter. If you're trading the chart, the chart says sell. If you're hunting bounces, the RSI says maybe. That's three different answers to the same question, which tells you everything about why trading is hard.


